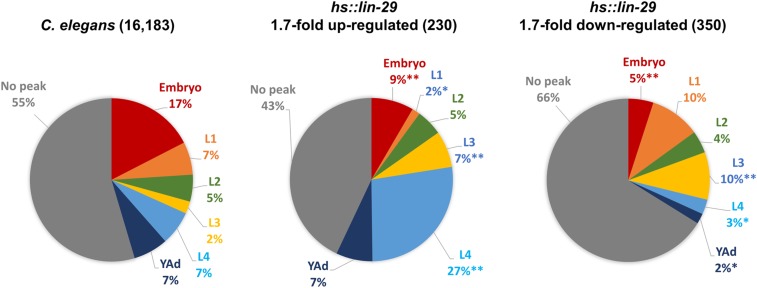
Figure 7.
Genes that normally peak in the L4 stage are overrepresented among LIN-29 upregulated targets. Temporal expression peaks were assessed for the indicated gene sets based on modENCODE RNA-seq data (Gerstein et al. 2010) using criteria from Jackson et al. (2014): genes showing ≥35% of their total developmental expression in one stage were identified as having a peak in that stage (color coded), the remainder are indicated as “no peak” (gray). Distributions for all genes in each set were calculated, displayed as percentages and compared to the genomic distribution (left). ** P < 0.0001 and * P < 0.01 (chi-square with Yates correction).

