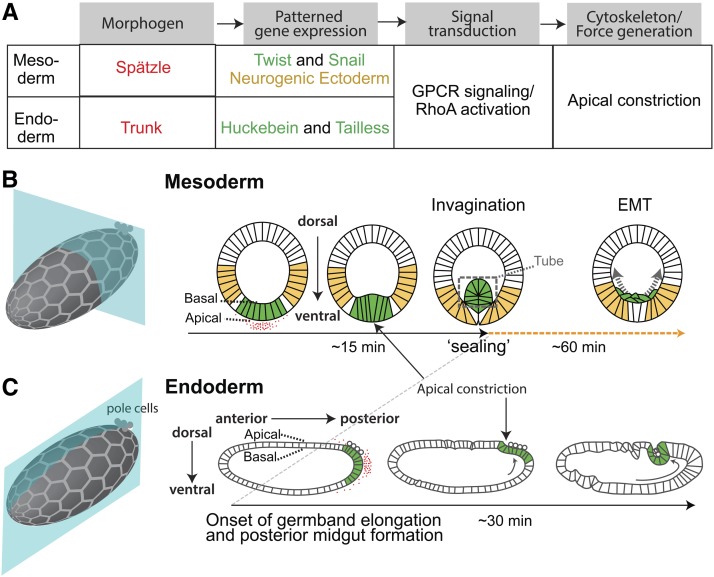
Figure 1.
Drosophila gastrulation overview. (A) Flow chart showing the regulation of cell shape changes that accompany Drosophila gastrulation. Colored text matches the colors in (B and C). (B) Cartoon showing mesoderm invagination in Drosophila. Hexagonal mesh illustrates plane of epithelium, but cell size is not to scale. Red shows pattern of active Spätzle. Green illustrates presumptive mesoderm cells, which express Twist and Snail in response to high levels of Dorsal. Yellow cells show region of ectoderm, which is specified by low levels of Dorsal. (C) Cartoon showing posterior endoderm invagination. Hexagonal mesh illustrates plane of epithelium, but cell size is not to scale. Red shows distribution of the signaling ligand Trunk. Green illustrates presumptive endoderm cells expressing Huckebein and Tailless. Arrow shows the direction of germband elongation.

