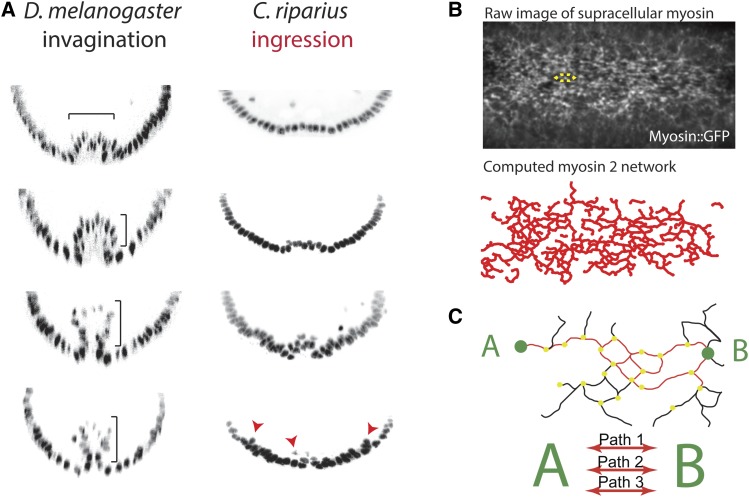
Figure 8.
Mechanisms that promote collective cell invagination. (A) Cross-section images of embryos with labeled nuclei comparing D. melanogaster and C. riparius mesoderm internalization. Bracket shows collective tissue invagination of Drosophila and arrows show individual cell ingression in C. riparius. Images are reproduced from Urbansky et al. (2016). (B) Image is a Z-projection of sqh::GFP showing the medioapical supracellular myosin 2 meshwork. The approximate size of an individual cell is highlighted by the yellow dotted line. A computed trace of the myosin 2 network is below the raw image. Images are from one of the data sets used in Yevick et al. (2019). (C) Cartoon illustrating structural redundancy of the supracellular myosin 2 network. Reproduced part of Graphical abstract from Yevick et al. (2019).

