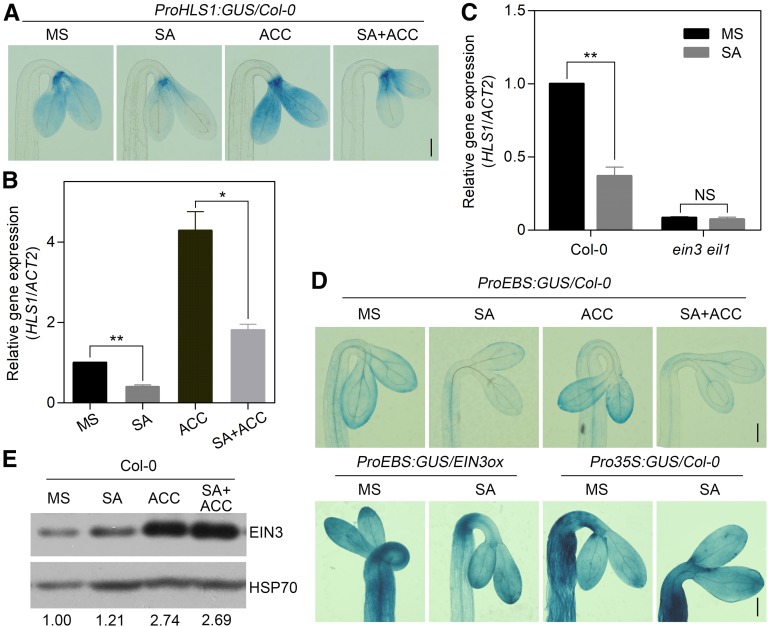
Figure 2.
SA Suppresses HLS1 Gene Expression by Inhibiting the Transcriptional Activity of EIN3/EIL1.
(A) GUS staining of 3.5-d-old etiolated seedlings that were grown on MS medium and then left either untreated (MS) or treated with 500 μM SA and/or 50 μM ACC for 4 h. GUS was driven by a 1.6-kb HLS1 promoter in Col-0. Bar = 200 μm.
(B) Real-time PCR analysis of HLS1 transcript levels in etiolated Col-0 seedlings. Seedlings were grown on MS medium for 3.5 d and then treated with 500 μM SA and/or 50 μM ACC for 4 h. Three biological replicates were performed. Values represent means ± sd (n = 3). Statistical significance was analyzed using a two-tailed Student’s t test (*P < 0.05, **P < 0.01).
(C) Real-time PCR analysis of HLS1 gene expression in both Col-0 and the ein3 eil1 double mutant. Seedlings were grown on MS medium for 3.5 d and then treated with 500 μM SA for 4 h. Three biological replicates were performed. Values represent means ± sd (n = 3) relative to the ACTIN2 (ACT2) control. Statistical significance was analyzed using a two-tailed Student’s t test (**P < 0.01). NS, not significantly different.
(D) GUS staining of 3.5-d-old etiolated transgenic seedlings. Seedlings were grown on MS medium either unsupplemented (MS) or supplemented with 50 μM SA and/or 1 μM ACC. GUS was driven by a synthetic EBS promoter either in Col-0 (top) or in EIN3ox (bottom left). GUS driven by the constitutive cauliflower mosaic virus 35S promoter is shown as a control in Col-0 (bottom right). Bar = 200 μm.
(E) Total endogenous EIN3 protein levels in etiolated Col-0 seedlings. Seedlings were grown on MS medium for 3.5 d followed by either no treatment (MS) or treatment with 500 μM SA and/or 50 μM ACC for 4 h. Total protein was extracted with SDS buffer as described in Methods. Endogenous EIN3 and HSP70 were detected using the corresponding antibody. The numbers below the lanes represent the ratio of EIN3 to HSP70 based on gray-value analysis normalized to the control (MS, left lane). More than three biological replicates were performed with similar results.

