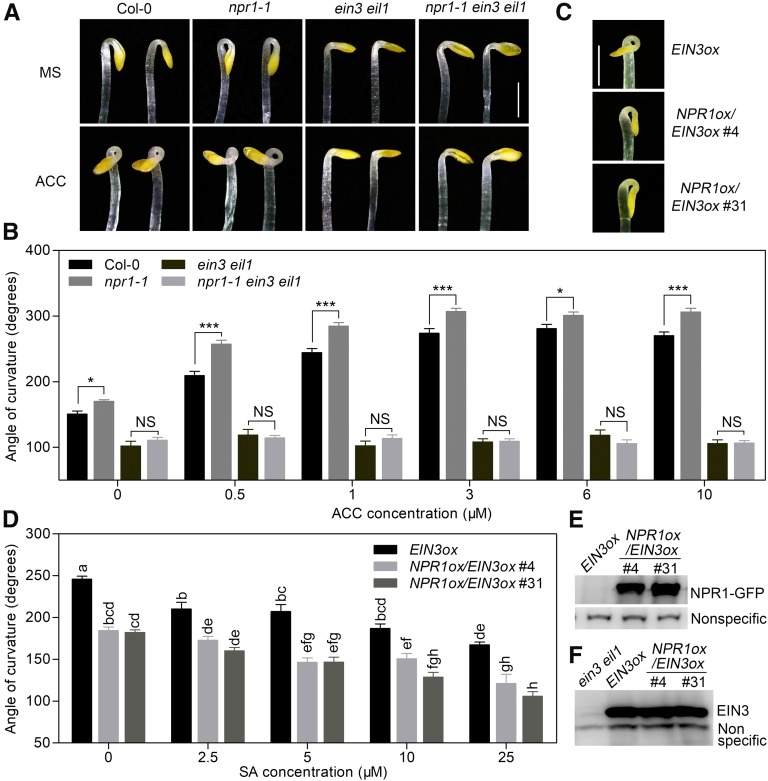
Figure 4.
NPR1 Acts Upstream of EIN3/EIL1 and Inhibits Hook Formation through EIN3/EIL1.
(A) Hook phenotypes of Col-0, npr1-1, ein3 eil1, and npr1-1 ein3 eil1 etiolated seedlings grown on MS with (ACC) or without (MS) 1 μM ACC medium for 3.5 d. Bar = 1 mm.
(B) Hook curvature angles of Col-0, npr1-1, ein3 eil1, and npr1-1 ein3 eil1 grown on MS containing a variety of ACC concentrations in the dark for 3.5 d. Values represent means ± se (n ≥ 15 seedlings). Statistical significance among Col-0, npr1-1, ein3 eil1, and npr1-1 ein3 eil1 was analyzed by one-way ANOVA with Bonferroni’s comparison test at a significance level of 0.05 (*P < 0.05, ***P < 0.001). NS, not significantly different.
(C) Hook phenotypes of EIN3ox and two independent NPR1ox/EIN3ox transgenic seedlings (#4 and #31) grown on MS medium for 3.5 d. Bar = 1 mm.
(D) Hook curvature in EIN3ox, NPR1ox/EIN3ox #4, and NPR1ox/EIN3ox #31 seedlings grown for 3.5 d on MS containing a variety of SA concentrations. Values represent means ± se (n ≥ 15 seedlings). Statistical significance was analyzed by one-way ANOVA along with Bonferroni correction at a significance level of 0.05. Different lowercase letters above the bars indicate a significant difference.
(E) Detection of NPR1-GFP in NPR1ox/EIN3ox transgenic seedlings using an anti-GFP antibody. A nonspecific band (bottom lanes) detected by the antibody represents a loading control.
(F) Detection of EIN3 in EIN3ox and NPR1ox/EIN3ox transgenic seedlings using an anti-EIN3 antibody. A nonspecific band (bottom bands) detected by the antibody represents a loading control.

