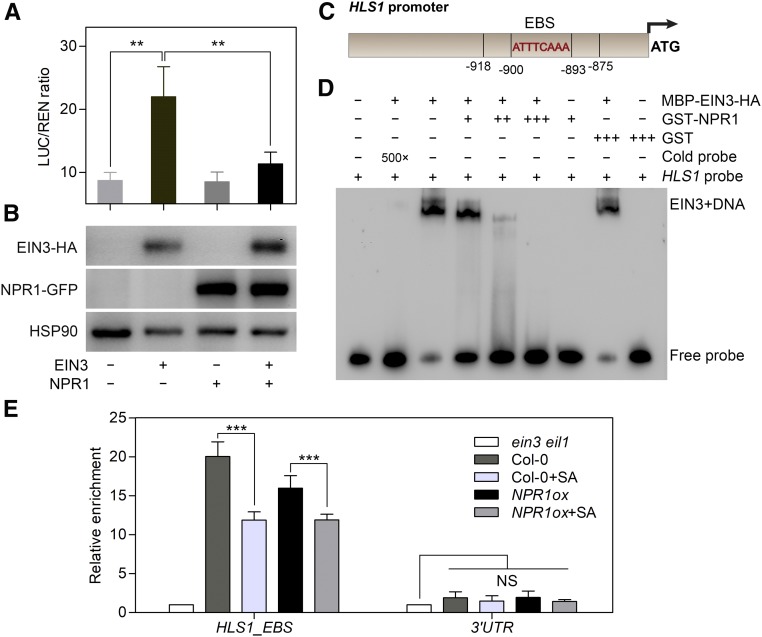
Figure 6.
NPR1 Represses the Binding of EIN3 to the HLS1 Promoter.
(A) A transient dual-LUC reporter assay illustrates the repressive effect of NPR1 on EIN3-induced HLS1 transcription. The ProHLS1:LUC/Pro35S:REN ratio indicates the relative transcriptional activity of EIN3 at the HLS1 promoter. Values represent means ± sd (n = 3 biological replicates). Statistical significance was analyzed by one-way ANOVA along with Bonferroni’s comparison test at a significance level of 0.05 (**P < 0.01).
(B) Detection of expressed EIN3-HA and NPR1-GFP protein in transformed protoplast cells from (A) using an anti-HA or anti-GFP antibody, respectively. Detection of HSP90 was used as a loading control. The label below the figures indicates the expressed effector proteins in each group.
(C) Schematic illustration of EBS in the HLS1 promoter used in our experiment. The 44-bp HLS1 probe used for EMSA contained sequences that harbored the EBS motif (from −918 bp to −875 bp upstream of the ATG codon). ATTTCAAA represents the core nucleic acid sequence of the EBS motif.
(D) Binding of EIN3 to the HLS1 promoter was repressed by NPR1 in vitro. Biotin-labeled HLS1 probe (10 fmol) was used in each reaction. Cold probe indicates unlabeled HLS1 probe, and 5 pmol of cold probe was used for competition with biotin-labeled HLS1 probe. GST-NPR1 was mixed with MBP-EIN3-HA protein at 1:1, 2:1, and 3:1 molar ratio. GST was used as a negative control. − indicates no protein supplemented; +, ++, and +++ indicate NPR1:EIN3 at molar ratios of 1:1, 2:1, and 3:1, respectively; 500× indicates that cold probe is a 500-fold excess of labeled HLS1 probe.
(E) ChIP-qPCR assays indicate the enrichment of EIN3 protein in the HLS1 promoter in vivo. An anti-EIN3 polyclonal antibody was used for EIN3-DNA immunoprecipitation from 3.5-d-old etiolated Col-0 and NPR1ox/Col-0 (D) seedlings treated with 50 μM ACC and/or 500 μM SA for 4 h. ein3 eil1 seedlings were regarded as the negative control. Values represent means ± sd (n = 3 biological replicates). Statistical significance (***P < 0.001) was analyzed by one-way ANOVA with Bonferroni’s comparison test at a significance level of 0.05. NS, not significantly different; UTR, untranslated region.

