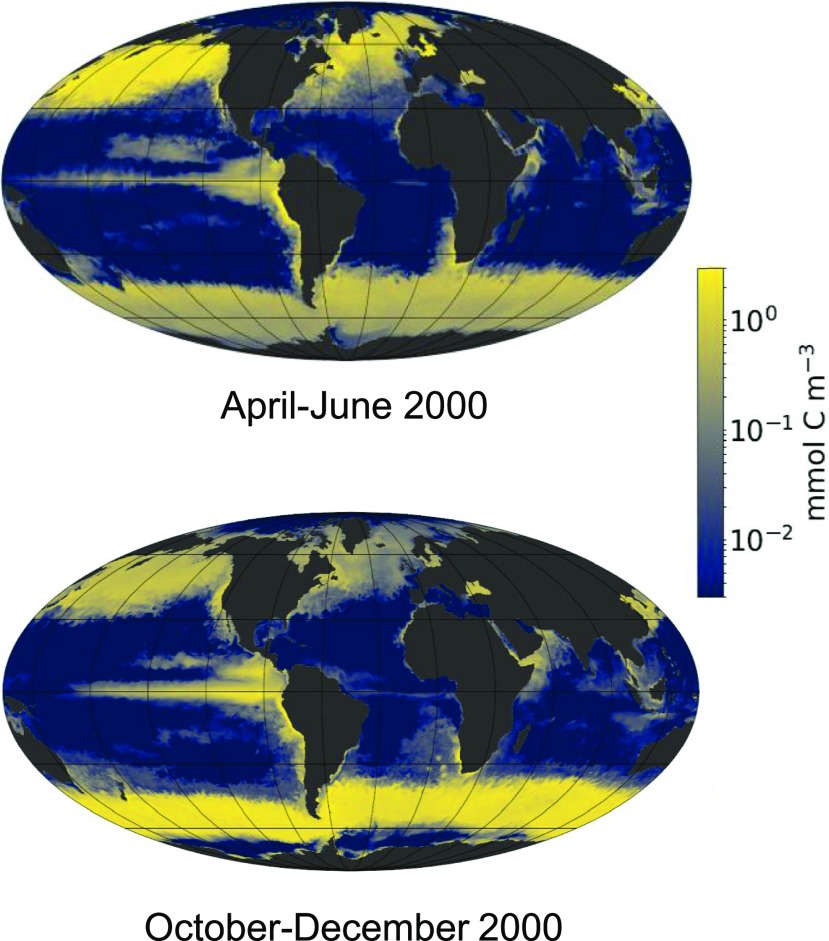
Figure 1.
Model of the Global Distribution of Diatom Biomass.
Model of the global distribution of diatom biomass in the ocean surface layer in April to June (left) and October to December (right) of 2000 (courtesy of Oliver Jahn, Stephanie Dutkiewicz, and Mick Follows). Biomass values, reported in log scale in units of mmol C m−3, were derived from the MIT ecosystem model, which simulates ocean circulation and key biogeochemical processes, e.g., nutrient fluxes, plankton growth, and death occurring in the ocean, at a global scale (Follows et al., 2007; Tréguer et al., 2018). Physiological data were derived from laboratory and field experiments. Because diatom biomass varies between ∼0.4 (P. tricornutum) and ∼7000 (Coscinodiscus wailesii) pmol C per cell, a biomass of 1 mmol C m−3 corresponds to a range of ∼150 cells L−1 to ∼2.5 106 cells L−1 (Marañón et al., 2013).

