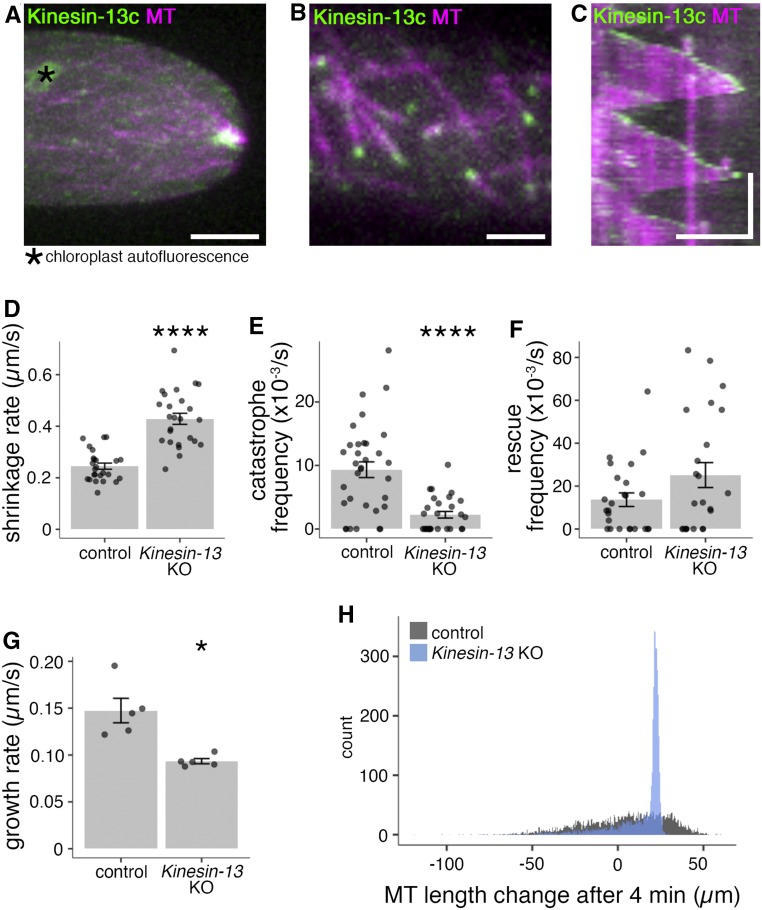
Figure 6.
Kinesin-13 Localizes to the Interphase MT Network and Depletion of Kinesin-13 Results in Increased Shrinkage Rate, Reduced Catastrophe Frequency, Increased Rescue Frequency, and Reduced Growth Rate.
(A) MT foci of Kinesin-13c-Citrine/mCherry-tubulin (GPH0100#15) moss. Images were acquired at 0.3-µm intervals over a 10-µm range; shown is maximum z-projection. Bar = 5 µm.
(B) Interphase MT network of Kinesin-13c-Citrine/mCherry-tubulin (GPH0100#15) moss. Images were acquired by oblique illumination fluorescence split-view microscopy to avoid chloroplast autofluorescence. Bar = 2 µm.
(C) Kymograph of MT growth taken from imaging as in (B), taken every 3 s. Vertical bar = 2 min; horizontal bar = 5 µm.
(D) Interphase MT plus end shrinkage rate of control (GFP-tubulin/histoneH2B-mRFP, 0.245 ± 0.012 µm/s [mean ± se; n = 25 cells]) and Kinesin-13 KO (GPH0438#30, 0.429 ± 0.021 µm/s [mean ± se; n = 25 cells; P-value < 0.0001, Welch’s two-sample t test]) moss. Points represent individual cells; results shown are from one experiment of two independent experiments.
(E) Interphase MT catastrophe frequency of control (GFP-tubulin/histoneH2B-mRFP, 9.3 ± 1.2 × 10⁻³/s [mean ± se; n = 33 cells]) and Kinesin-13 KO (GPH0438#30, 2.2 ± 0.5 × 10⁻³/s [mean ± se; n = 28 cells; P-value < 0.0001, Welch’s two-sample t test]). Points represent individual cells; results shown are from two independent experiments.
(F) Interphase MT rescue frequency of control (GFP-tubulin/histoneH2B-mRFP, 14 ± 3 × 10⁻³/s [mean ± se; n = 25 cells]) and Kinesin-13 KO (GPH0438#30, 25 ± 6 × 10⁻³/s [mean ± se; n = 23 cells]). Points represent individual cells; results shown are from two independent experiments.
(G) Interphase MT plus end growth rate of control (EB1-Citrine/mCherry-tubulin, GPH0379#2, 0.147 ± 0.013 µm/s [mean ± se; n = 5 cells, 50 MTs]) and Kinesin-13 KO moss (GPH0577#11, 0.093 ± 0.003 µm/s [mean ± se; n = 5 cells, 50 MTs; P-value < 0.05, Welch’s two-sample t test]). Points represent individual cells.
(H) Simulation of MT growth of 4000 MTs in 4 min based on a probability model established using MT dynamics parameters from in vivo interphase MT dynamics analyses (D) to (G) (see Methods and Table 1). Control MT dynamics parameters yielded approximately normal distributions of MT lengths and tended to have a larger population of MTs with longer lengths, with the longest 25% of MTs ranging between 23.4 to 59.8 µm in length. For MTs under Kinesin-13 KO conditions, the distribution of MT length was narrower, with 50% of all MTs being from 11.5 to 22.6 µm in length, whereas the longest 25% of MTs ranged from 22.6 to 29.4 µm in length. Histogram bin width = 0.5 µm.

