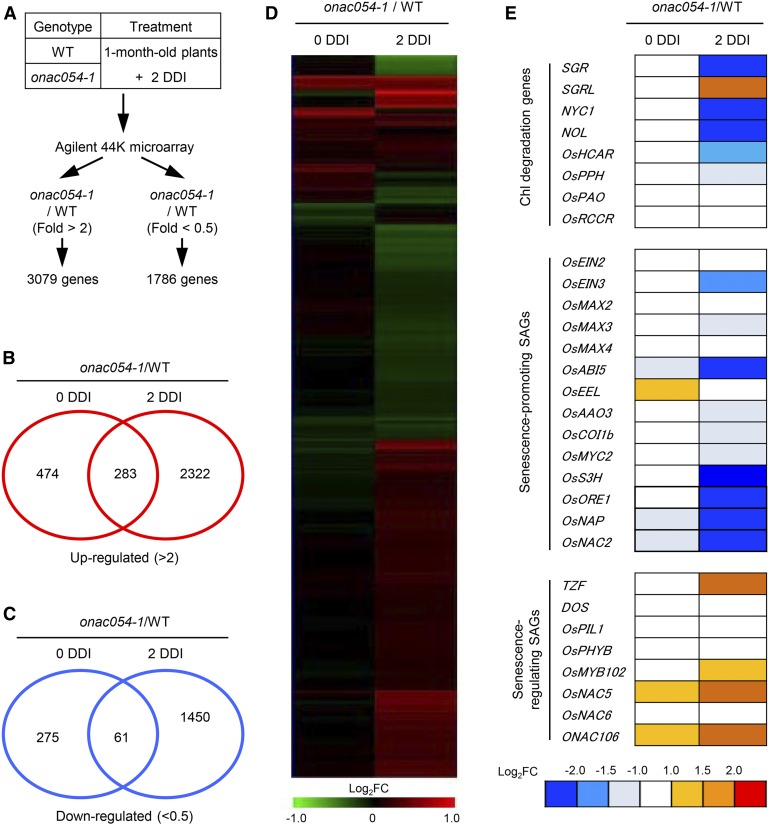
Figure 5.
Altered Expression of SAGs in the onac054-1 Mutant during DIS.
(A) A summary of the microarray analysis. A filter for Student’s t test P value of < 0.05 was applied to DEGs. WT, wild type.
(B) and (C) Venn diagrams of the number of DEGs in the onac054-1 mutant compared to the wild type (WT). The numbers of up-regulated (B) and down-regulated genes (C) in the onac054-1 mutant at 0 and 2 DDI are shown.
(D) Hierarchical average linkage clustering of genes differentially expressed between wild-type (WT) and onac054-1 plants.
(E) The ratios of expression levels (onac054-1/wild type [WT]) for known or putative SAGs at 0 and 2 DDI are illustrated. The relative expression value was normalized to the WT expression level.

