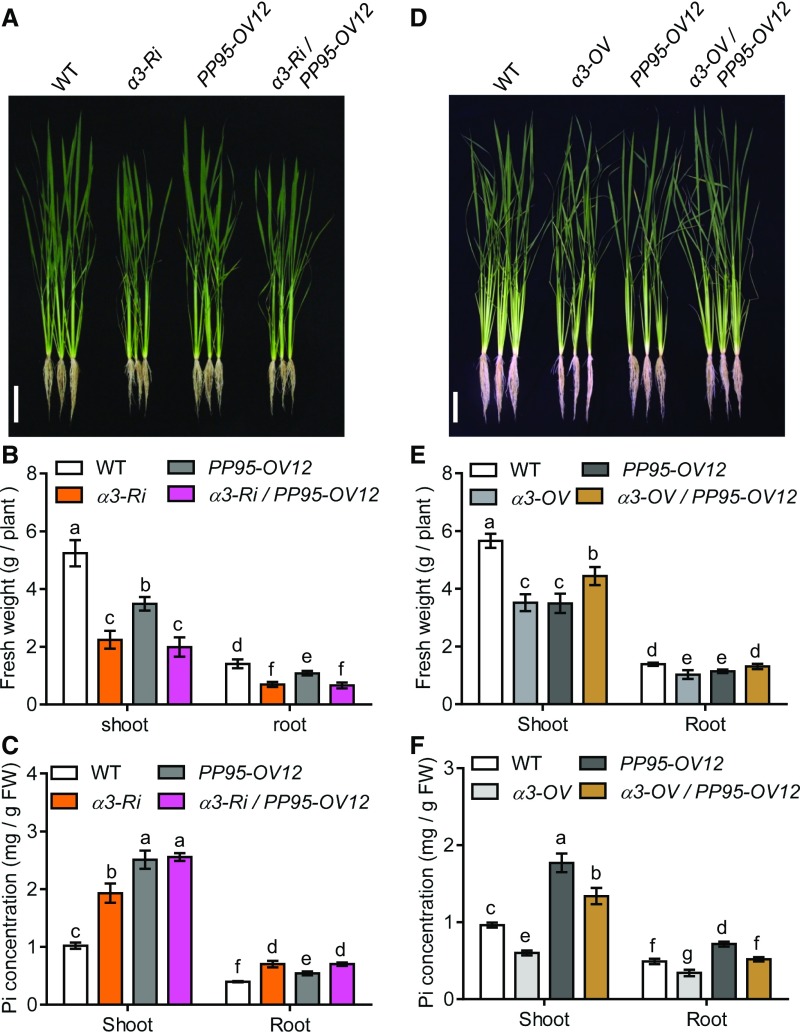
Figure 5.
Genetic Interaction between CK2 and PP95 in Rice.
(A) Phenotypes of wild-type, CK2α3-RNAi (α3-Ri), PP95-OV12, and α3-Ri/PP95OV-12 whole seedlings grown under Pi-sufficient (HP, 200 μM) conditions for 20 d (10-d-old plants were used for treatment). Bar = 10 cm.
(B) Shoot and root fresh weight of plants described in (A). Error bars represent sd (n = 9).
(C) Pi concentrations in shoots and roots of plants described in (A). FW, fresh weight. Error bars represent sd (n = 3).
Different letters in (B) and (C) indicate significant differences (Duncan’s multiple range test, P < 0.05).
(D) Phenotypes of wild-type, CK2α3 overexpression line (α3-OV), PP95-OV12, and α3-OV/PP95-OV12 whole seedlings grown under HP conditions for 20 d (10-d-old plants were used for treatment). Bar = 10 cm.
(E) Shoot and root fresh weight of plants described in (D). Error bars represent sd (n = 9).
(F) Pi concentrations in shoots and roots of plants described in (D). Error bars represent sd (n = 3).
Different letters in (E) and (F) indicate significant differences (Duncan’s multiple range test, P < 0.05).

