Figure 6.
Characterization and Metabolite Analysis of 2-Week-Old Seedlings Varying in PUMY Expression.
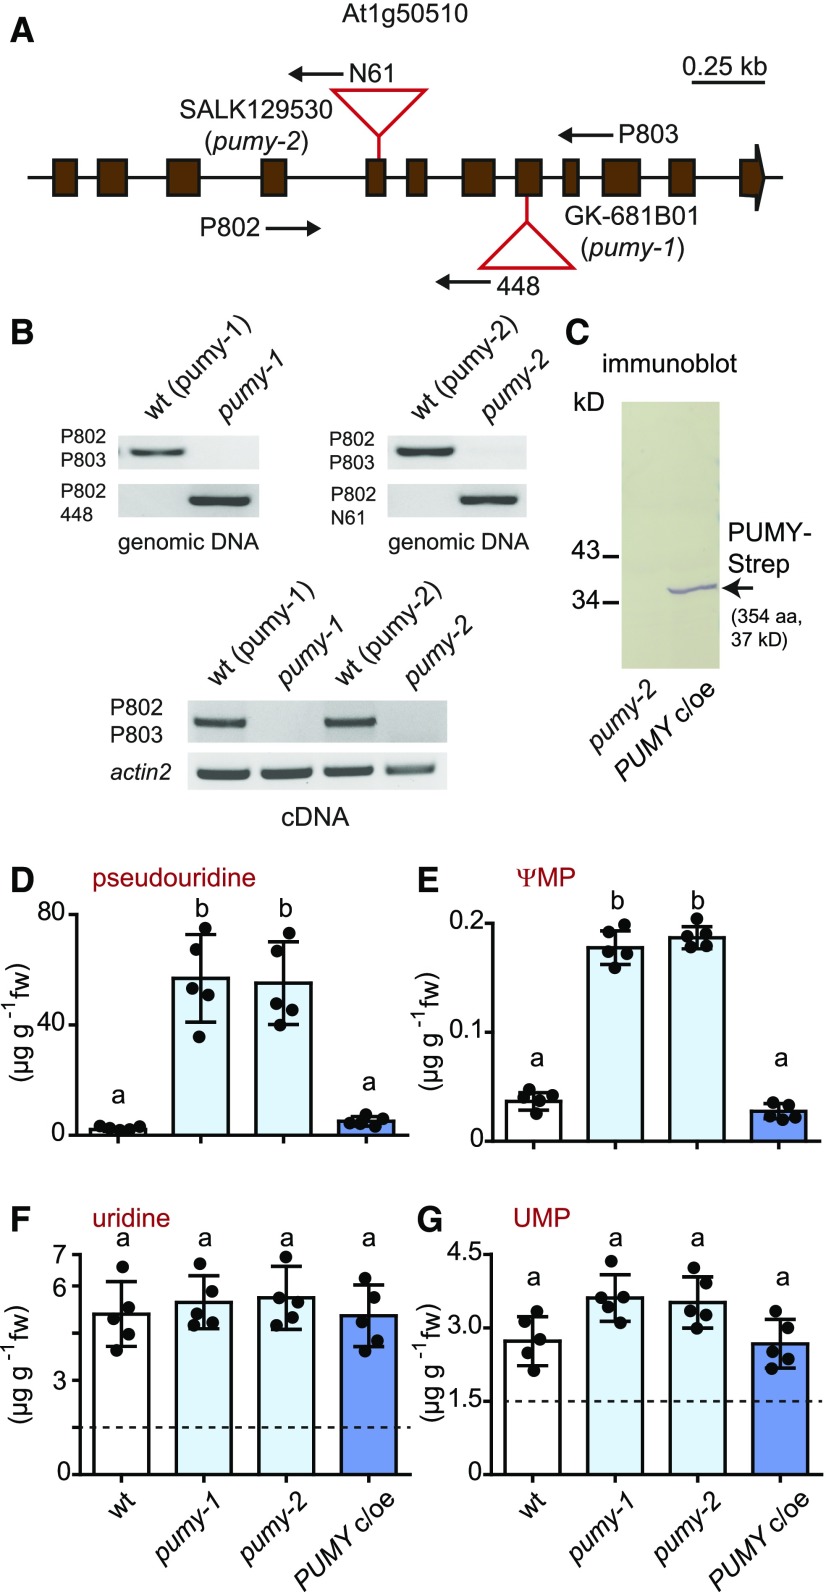
(A) Genomic organization of the At1g50510 locus encoding PUMY and positions of the T-DNA insertions (red triangles) in pumy-1 (GK681B01) and pumy-2 (SALK129530). The coding sequence (brown boxes) interrupted by noncoding regions (lines) is shown. Primer positions are indicated by arrows.
(B) PCR analysis of the wild-type and T-DNA alleles (top panels) and RT-PCR to assess the presence of intact mRNA (bottom panel) in homozygous pumy-1 and pumy-2 lines and their corresponding wild types, wt (pumy-1) and wt (pumy-2), selected from the segregating mutant populations.
(C) Immunoblot analysis of seedling extracts from the PUMY-Strep complementation and overexpression line (PUMY c/oe) generated in the pumy-2 background compared with the pumy-2 line. An anti-Strep tag antibody was used for detection. aa, amino acids.
(D) to (G) pseudouridine, ΨMP, uridine, and UMP contents in 2-week-old seedlings of the wild type (wt, white), the two pumy lines (light blue), and the PUMY c/oe line (dark blue). Error bars are sd (n = 5 biological replicates; lines were all grown together on one plate; for each line, material from five distinct plates was harvested.) Different letters label data that are significantly different at P < 0.05. fw, fresh weight.

