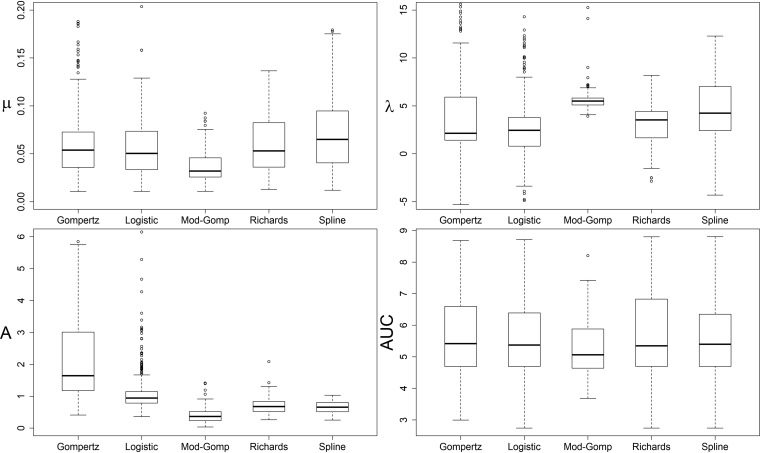
FIG 1.
Distribution of growth parameter values (μ = maximum growth rate, λ = lag phase, MaxOD = maximum OD600, AUC = area under curve) among the fitted L. monocytogenes strains by Gompertz, logistic, modified Gompertz, and Richards models and model-free spline. Whiskers depict the highest and lowest quartiles, and the box depicts the middle quartiles divided by median line. y axes have been cut to focus on quartiles and remove the most extreme individual outliers.

