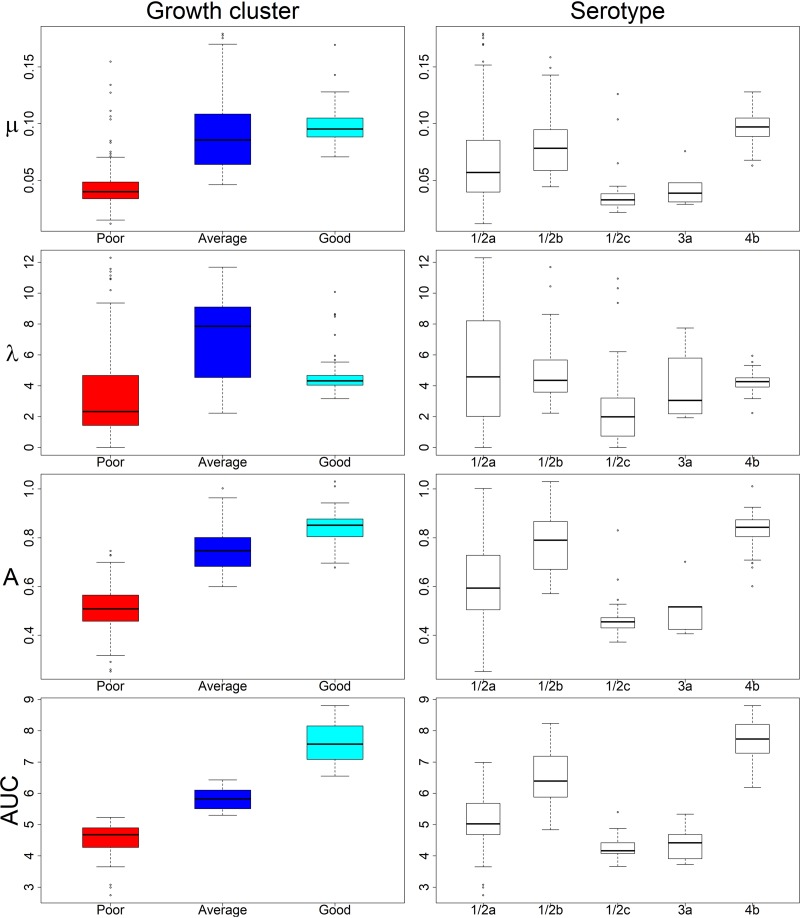
FIG 3.
Variation of spline growth parameters of L. monocytogenes strains (n = 388) in 9.0% NaCl within identified growth clusters and serovars. Whiskers indicate the highest and lowest quartiles, and the box depicts the middle quartiles divided by median line. Dots indicate outliers. Growth parameters are calculated from spline fit: μ corresponds to growth rate (OD600 U/h), λ to lag time (h), MaxOD to maximum growth (OD600 units), and AUC to the area under curve calculated by an integral.

