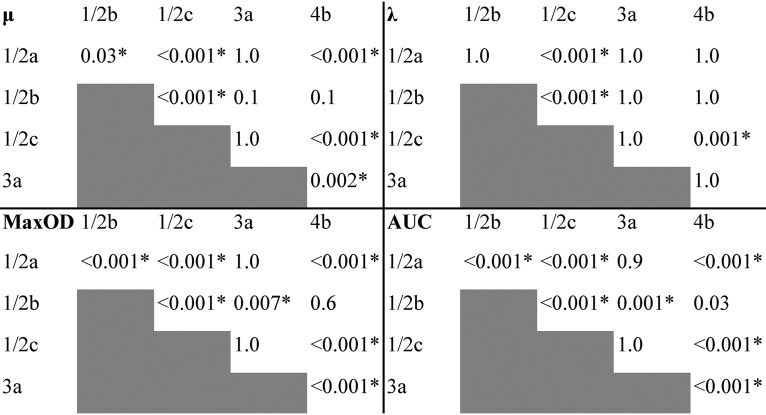
FIG 5.
Kruskal-Wallis test P values for the associations of each spline growth parameter between the tested serovar 1/2a, 1/2b, 1/2c, 3a, and 4b Listeria monocytogenes strains (n = 388) at 9.0% NaCl. Significant associations are indicated with an asterisk. μ corresponds to growth rate (OD600 U/h), λ to lag time (h), MaxOD to maximum growth (OD600 units), and AUC to the area under curve calculated by an integral.

