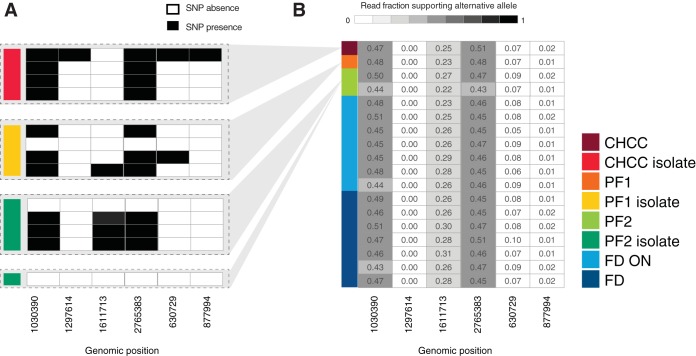
FIG 4.
Analysis of SNPs in isolates. (A) Binary table of SNP calls in CHCC, PF1, and PF2 isolates. Each row represents an isolate sample, colored as in Fig. 1. Gray areas indicate the production samples from which the isolates are derived. Columns represent genome locations. Black cells represent calls of significant SNPs compared to the reference genome (note that no SNPs were called in the production sample genomes, only in isolates). (B) Fraction of read support in production samples for SNPs identified in panel A. Rows indicate each production sample, colored as in Fig. 1. Columns indicate the same genome locations as in panel A. Cell numbers and shading indicate the fraction of reads in each sample that support the alternative allele.

