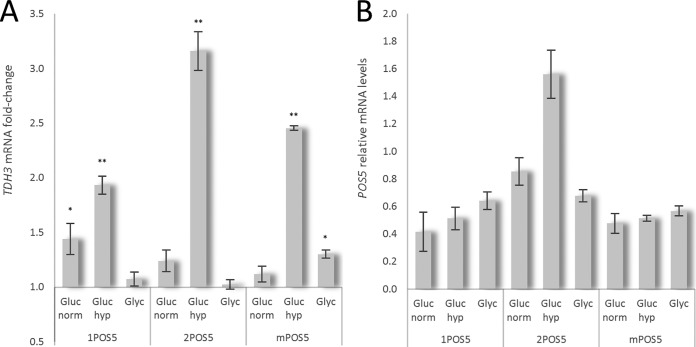
FIG 4.
Transcriptional analysis of chemostat cultivations. (A) Relative changes of TDH3 mRNA levels in POS5 strains are expressed as fold change from the TDH3 levels in the reference strain. (B) POS5 mRNA levels are expressed as relative expression levels to ACT1 (POS5/ACT1 signal) for each individual strain and condition (*, P < 0.05; **, P < 0.01) compared to the control strain. Error bars show the standard deviation of the results from three technical replicates. Gluc, glucose; norm, normoxia; Glyc, glycerol; hyp, hypoxia.

