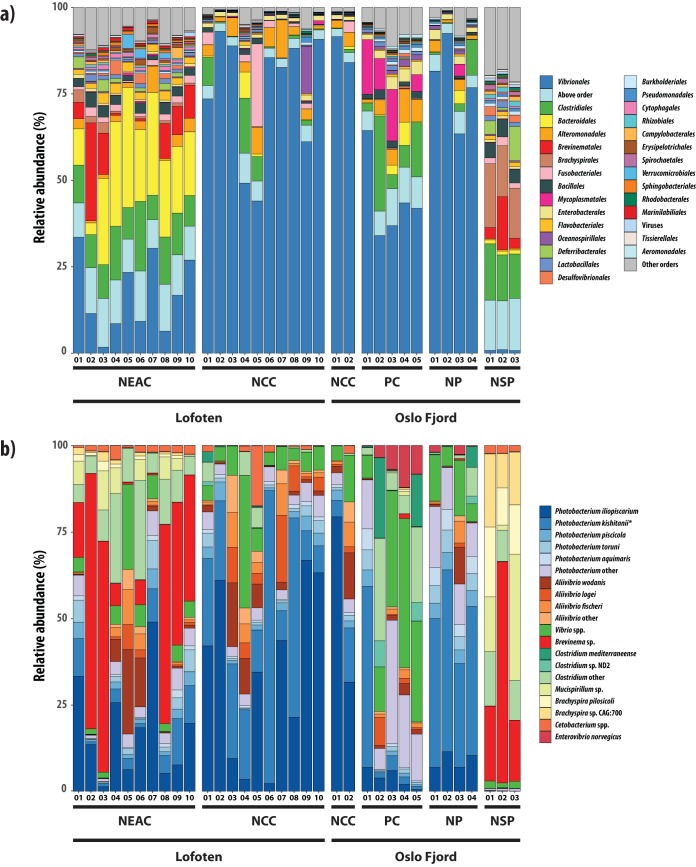
FIG 2.
Taxonomic composition of the fish intestinal microbiomes. (a) Relative abundance of metagenomic shotgun sequences classified at the order level (93%). Colors represent the 28 orders with highest relative abundance, sequences assigned to other orders or viruses, and sequences classified above order level. Numbers along the x axis indicate the individual samples of the different species/ecotypes. (b) Relative abundance of metagenomic shotgun sequences classified at the species level (66%). The plot includes the most highly abundant species and other members of their parent bacterial genera (“other” categories) in the different fish species/ecotypes. Numbers along the x axis indicate the individual samples of the different species/ecotypes. The asterisk denotes the P. kishitanii strain that was reclassified from P. phosphoreum.

