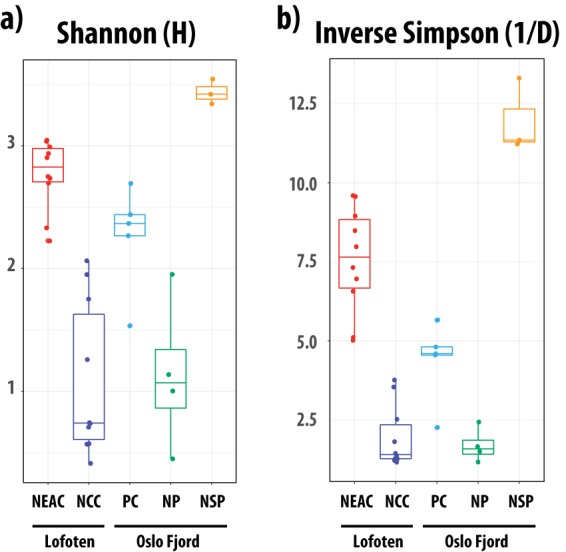
FIG 3.

Within-sample microbial diversity in the gadoid species and ecotypes. Boxplots of Shannon (a) and inverse Simpson (b) diversity in the fish species/ecotypes. Each individual is represented by a point, and the individuals are grouped and colored by species and ecotype. The middle band represents the median, while the upper and lower bands show the 75th and 25th percentiles. The boxplots include the minimum and maximum alpha diversity values.
