
FIG 2.
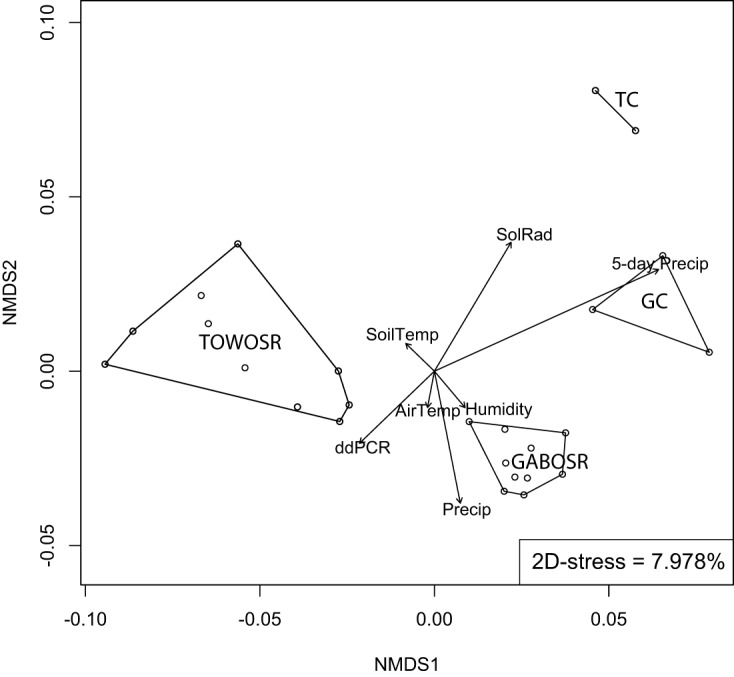
Effect of environmental parameters on microbial community structure. The graph shows nonmetric multidimensional scaling (NMDS) of the sequenced communities based on whole-community MASH distances. Each dot represents a metagenome sample, and metagenomes from the same location are connected by lines. Location (i.e., the polygons or lines) was the only variable that significantly correlated with the ordination. Arrowed vectors indicate correlations with other variables; however, none of these reached statistical significance (using the envfit function in the R package vegan). SoilTemp, AirTemp, SolRad, Precip, 5-day Precip, and ddPCR represent soil temperature, air temperature, solar radiation, day-of precipitation, 5-day precipitation, and digital droplet PCR counts for STEC, respectively.