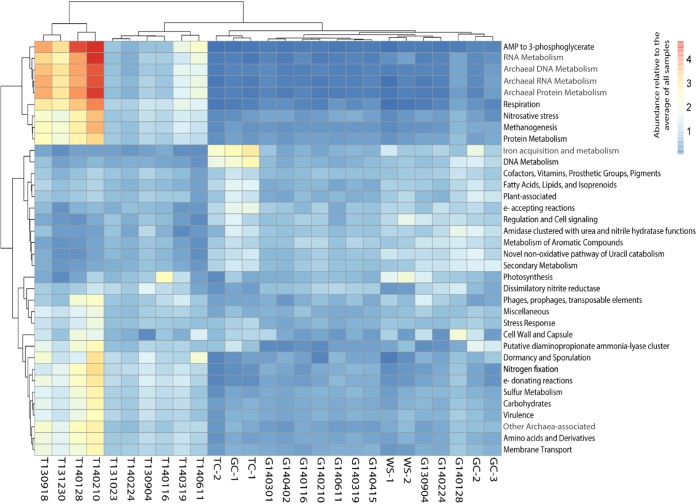
FIG 3.
Functional profiles of creek sediment microbial communities. The heat map shows SEED subsystems that were differentially abundant between locations (TOWOSR, GABOSR, and the upstream controls) with Padj of <0.05. Color scale indicates the abundance relative to the average of all samples (increasing from blue to red). Letters T or G and date in the column names represent the sample site (TOWOSR or GABOSR) and collection date, respectively. TC, GC, and WS represent the upstream TOWOSR control, GABOSR control, and West Salinas, respectively.

