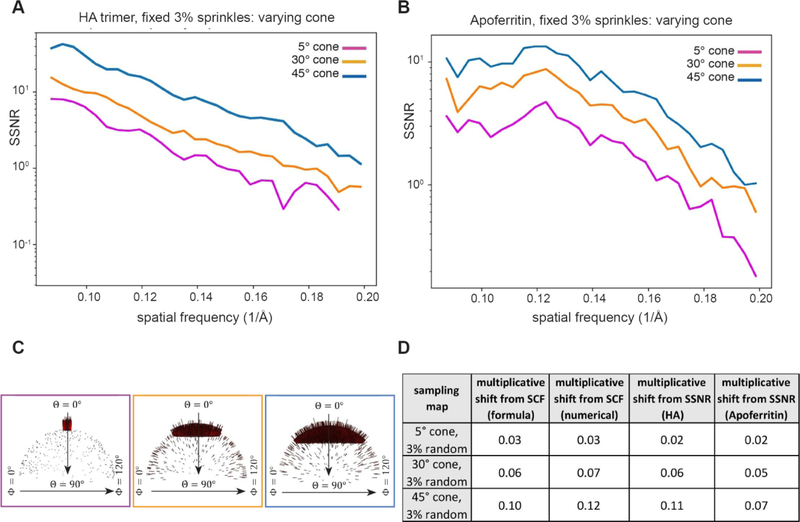
Figure 10. Attenuation of the SSNR due to the projection distribution for top-like cases characterized by varying cone sizes.
As in Figure 9, for both HA and Apoferritin, we examined the effect of the SCF on the SSNR for poorly sampled cases, where the projection distributions were constrained to varying cone sizes, but the number of random projections was fixed at 3%. This leads to Fourier space being sparsely sampled around the z-axis in each case. (A–B) Decrement of the SSNR for (A) HA and (B) Apoferritin with (C) the corresponding Euler angle distribution profiles. Even though there is a low percentage of views in certain regions, the total sampling is not small, because the total number of particles is 104. (D) Table showing the decrement in SCF. In each case, there is a crude agreement between the analytical expectation for the SCF, the numerically calculated SCF, and the shifts of the SSNR.

