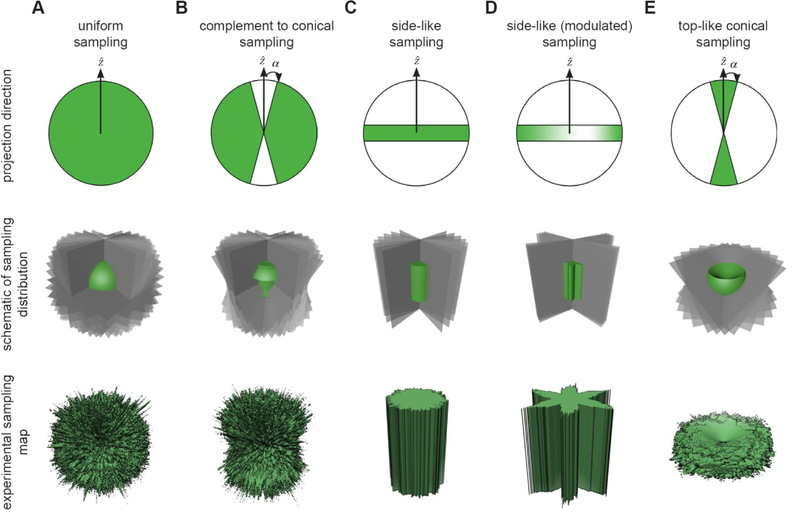
Figure 4. Projection distributions used to evaluate sampling.
The first row denotes the directions of the projections (green); the middle row provides a schematic of the sampling (Fourier slices are in gray and the sampling map schematic is in green); the last row shows the experimental sampling map from 10,000 slices inserted into the 3D FT. (A) The uniform sampling distribution evenly covers the entirety of reciprocal space. (B) “side-like” projections are uniformly drawn from the complement to a cone of half angle, α. The uncovered region is orthogonal to the cone and lies along the X/Y plane. (C) Projections are drawn from the side, which corresponds to the α→π/2 limit of case B (Euler angle θ=90°). (D) In addition, we incorporated azimuthal oscillations (Euler angle ϕ is modulated), which increases the fluctuation of side view sampling. The depth of the oscillations is governed by a parameter, λ, and we term this scenario modulated side-views. (E) Projections are drawn from within a cone of half angle α. Unlike the other cases, the top-like distributions always have missing conical regions of Fourier space inversely related to the size of the half-angle α. For this reason, we ultimately include an additional parameter, ϵ, which represents the fraction of projections scattered randomly over the projection sphere.

