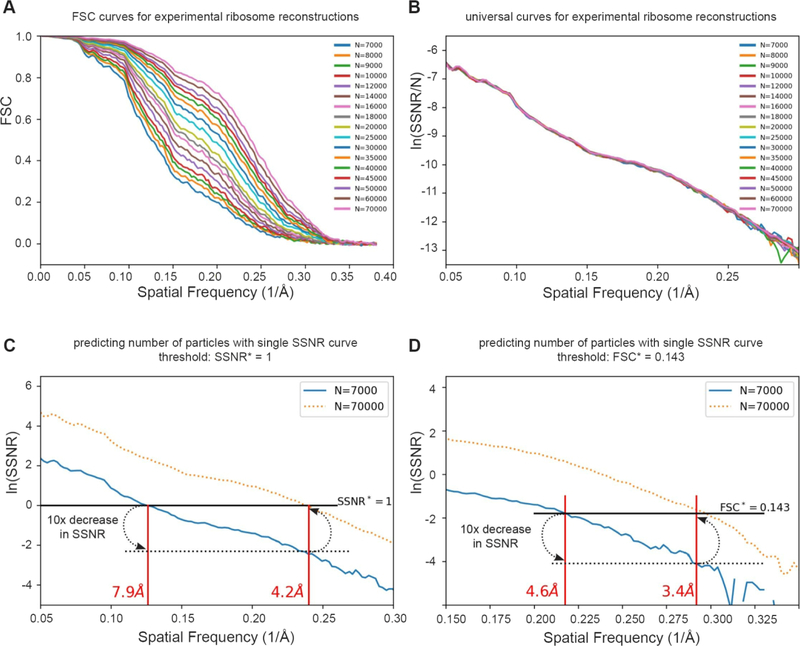
Figure 7. Predicting the number of particles based on per-particle SSNR curves.
(A) We reexamined seventeen of the FSC curves with the largest numbers of particles from Passos et al [32]. (B) A plot of the per-particle ln(SSNR/N) shows that these seventeen distinct curves collapsed approximately to a single curve. (C–D) Since each curve contains essentially the same information, we can estimate the number of particles needed to achieve a target resolution. For example, one may wish to know the approximate experimental resolution by increasing the number of particles by tenfold from 7,000 (solid blue line) to 70,000. (C) using the SSNR*=1 threshold (solid black line), one would find the intercept corresponding to a 10x decrease in ln(SSNR) (dotted black line), and plot that back onto the solid SSNR* = 1 line. The experimental ln(SSNR) curve for 70,000 particles (dotted orange line) shows a correspondence between the prediction and the experimental intercept. (D) The same argument approximately holds for the FSC* = 0.143 criterion, or for other thresholds.

