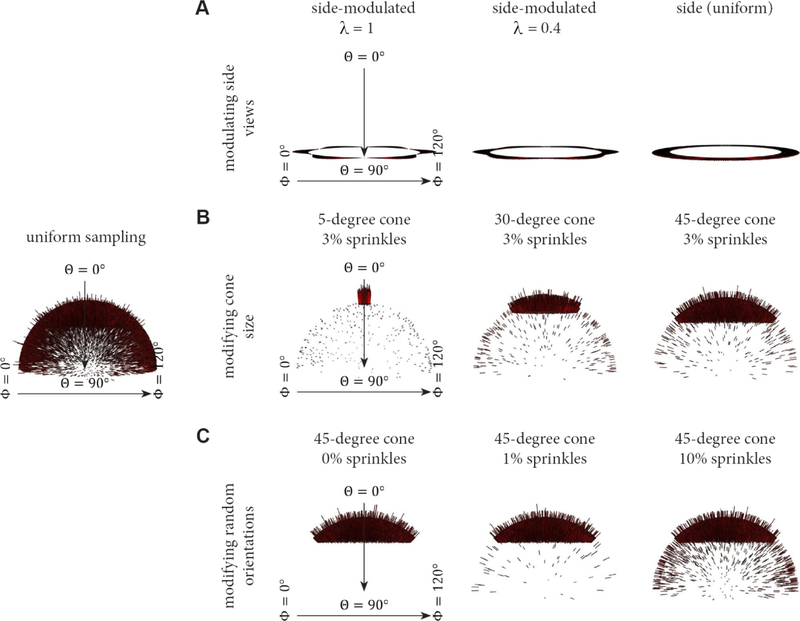
Figure 8. Euler angle sampling schemes used in this study.
The projection distributions described in Figure 4 can be modulated to evaluate distinct conditions. For each scenario, Euler angle distributions for 10,000 projections are displayed. A uniform distribution of views across Euler space is shown at left for comparison. (A) The side-modulated case, whereby the Euler angle θ is 90°, but ϕ is modulated in accordance with the modulation parameter, λ. This scenario corresponds to the transition between Figure 4C–D. (B) The top-like case, whereby the size of the cone is varied, and there is a fixed amount of randomly distributed views across the rest of Euler space. (C) The top-like scenario, whereby the size of the cone remains constant at 45°, but the amount of randomly distributed views is varied across Euler space. The experimental results corresponding to these three cases will be described in Figures 9–11.

