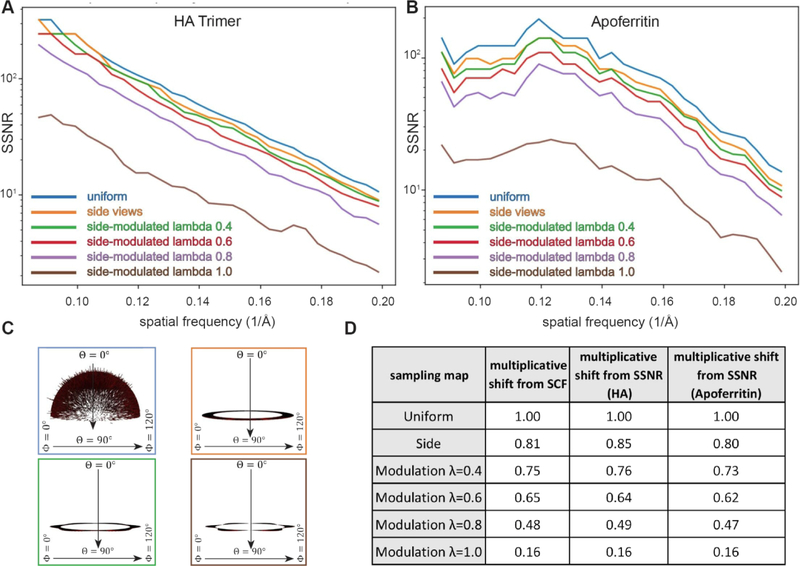
Figure 9. Attenuation of the SSNR due to the projection distribution for side-like cases characterized by thorough sampling.
(A–B) Two synthetic datasets corresponding to (A) the HA trimer and (B) Apoferritin were reconstructed, as described in section 5. The decrement, which is reflected by the shift in the SSNR due to the different type of sampling distributions is displayed. (C) Euler angle distribution profiles corresponding to selected cases from A-B. (D) Table showing the decrement in SCF and the multiplicative shift from SSNR. For each of the 6 different sampling distributions, the numerical and analytical forms for the SCF agree (except for λ = 1, where we only have a numerical formula), and thus only a single multiplicative shift from SCF is indicated.

