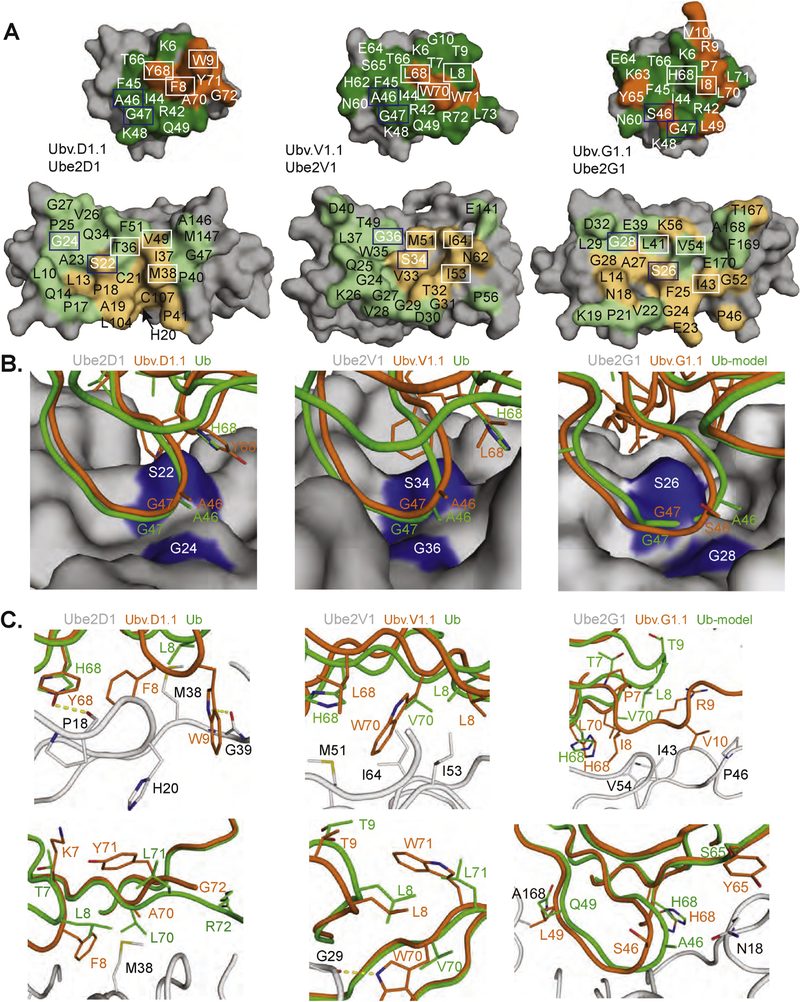
Fig. 4. Interactions at the UbV-E2 interfaces.

(A) Contact surfaces at the interface between UbV.D1.1 and Ube2D1 (left), UbV.V1.1 and Ube2V1 (center), and UbV.G1.1 and Ube2G1 (right). The complex is shown in an open book view with the UbV at the top and the E2 protein at the bottom. The proteins are shown as molecular surfaces with noncontact residues colored gray. Substituted or wt contact residues on the UbV are colored orange or green, respectively. Residues on the E2 that contact substituted or wt residues on the UbV are colored light orange or light green, respectively. UbV and E2 residues forming the hydrophobic pocket and adjacent contact surface are boxed in white or blue and are shown as sticks in panels B and C. (B,C) Interactions between the E2 backside pocket and UbV side chains are shown for Ube2D1and UbV.D1.1 (left), Ube2V1 and UbV.V1.1 (center), and Ube2G1 and UbV.G1.1 (right). The E2 protein from each UbV-E2 complex is shown as a surface in (B) or as a gray ribbon with indicated side chains in (C). The interacting side chains and associated backbones of the UbV, or Ub.wt for comparison, are colored orange or green, respectively. In the case of Ube2G1, a structure in complex with Ub.wt is not available, and thus, the complex was modeled by superposition of Ub.wt with UbV.G1.1 in the UbV.G1.1-Ube2G1 structure.
