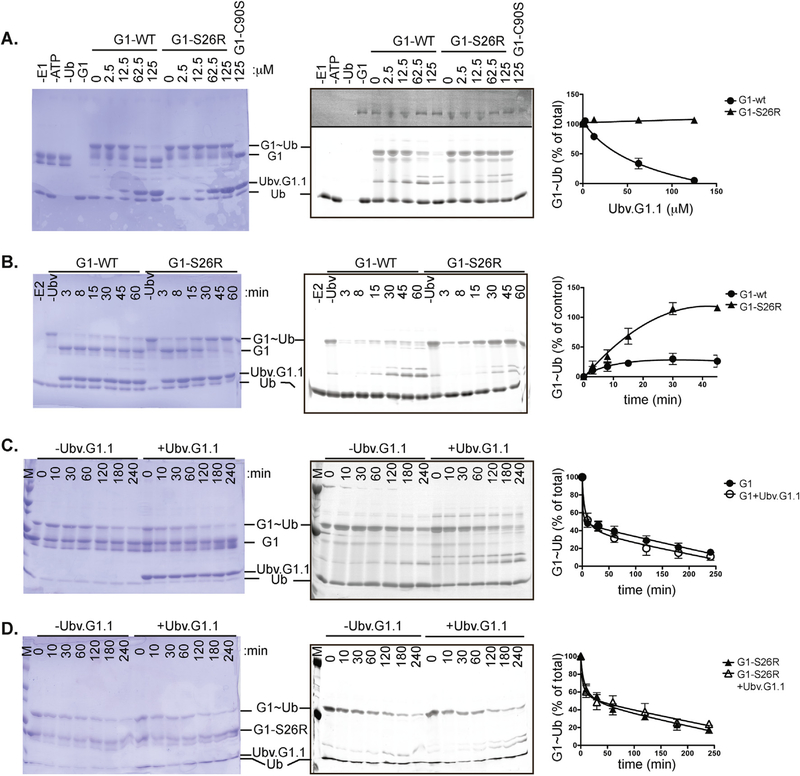
Fig. 6. UbV.G1.1 inhibits Ub charging of Ube2G1.
(A) Effect of UbV.G1.1 on Ube2G1~Ub formation. Charging reactions containing 0.20 μM E1, 5 μM Ube2G1 or Ube2G1-S26R, 25 μM Ub-Fluor, 2 mM ATP, and 5 mM MgCl2 were incubated with indicated amounts of UbV.G1.1 for 30 min. Coomassie blue staining (left panel) and fluorescent scanning (center panel) of the gel.are shown. The level of Ube2G1~Ub and Ube2G1-S26R~Ub was quantified (right panel) relative to a 30 min reaction in the absence of UbV.G1.1. (B) Time course of Ube2G1~Ub formation in the presence of Ubv.G1.1. Ube2G1 and Ube2G1-S26R charging reactions were performed with 62.5 μM UbV.G1.1 for the indicated times and analyzed as described earlier. (C,D) Discharge of (C) Ube2G1 or (D) Ube2G1-S26R in the presence of Ubv.G1.1. Ube2G1 or Ube2G1-S26R was charged with Ub-Fluor for 30 min; the discharge reaction was initiated by addition of 1 unit apyrase, 40 mM lysine, 25 mM EDTA, and 50 μM UbV.G1.1. After the indicated time, the reaction was stopped with SDS sample loading buffer. Gels were scanned at 480 nm on a Typhoon fluorescence scanner (GE LifeSciences); bands were quantified using ImageQuant TL (GE LifeSciences) and visualized using Coomassie blue staining

