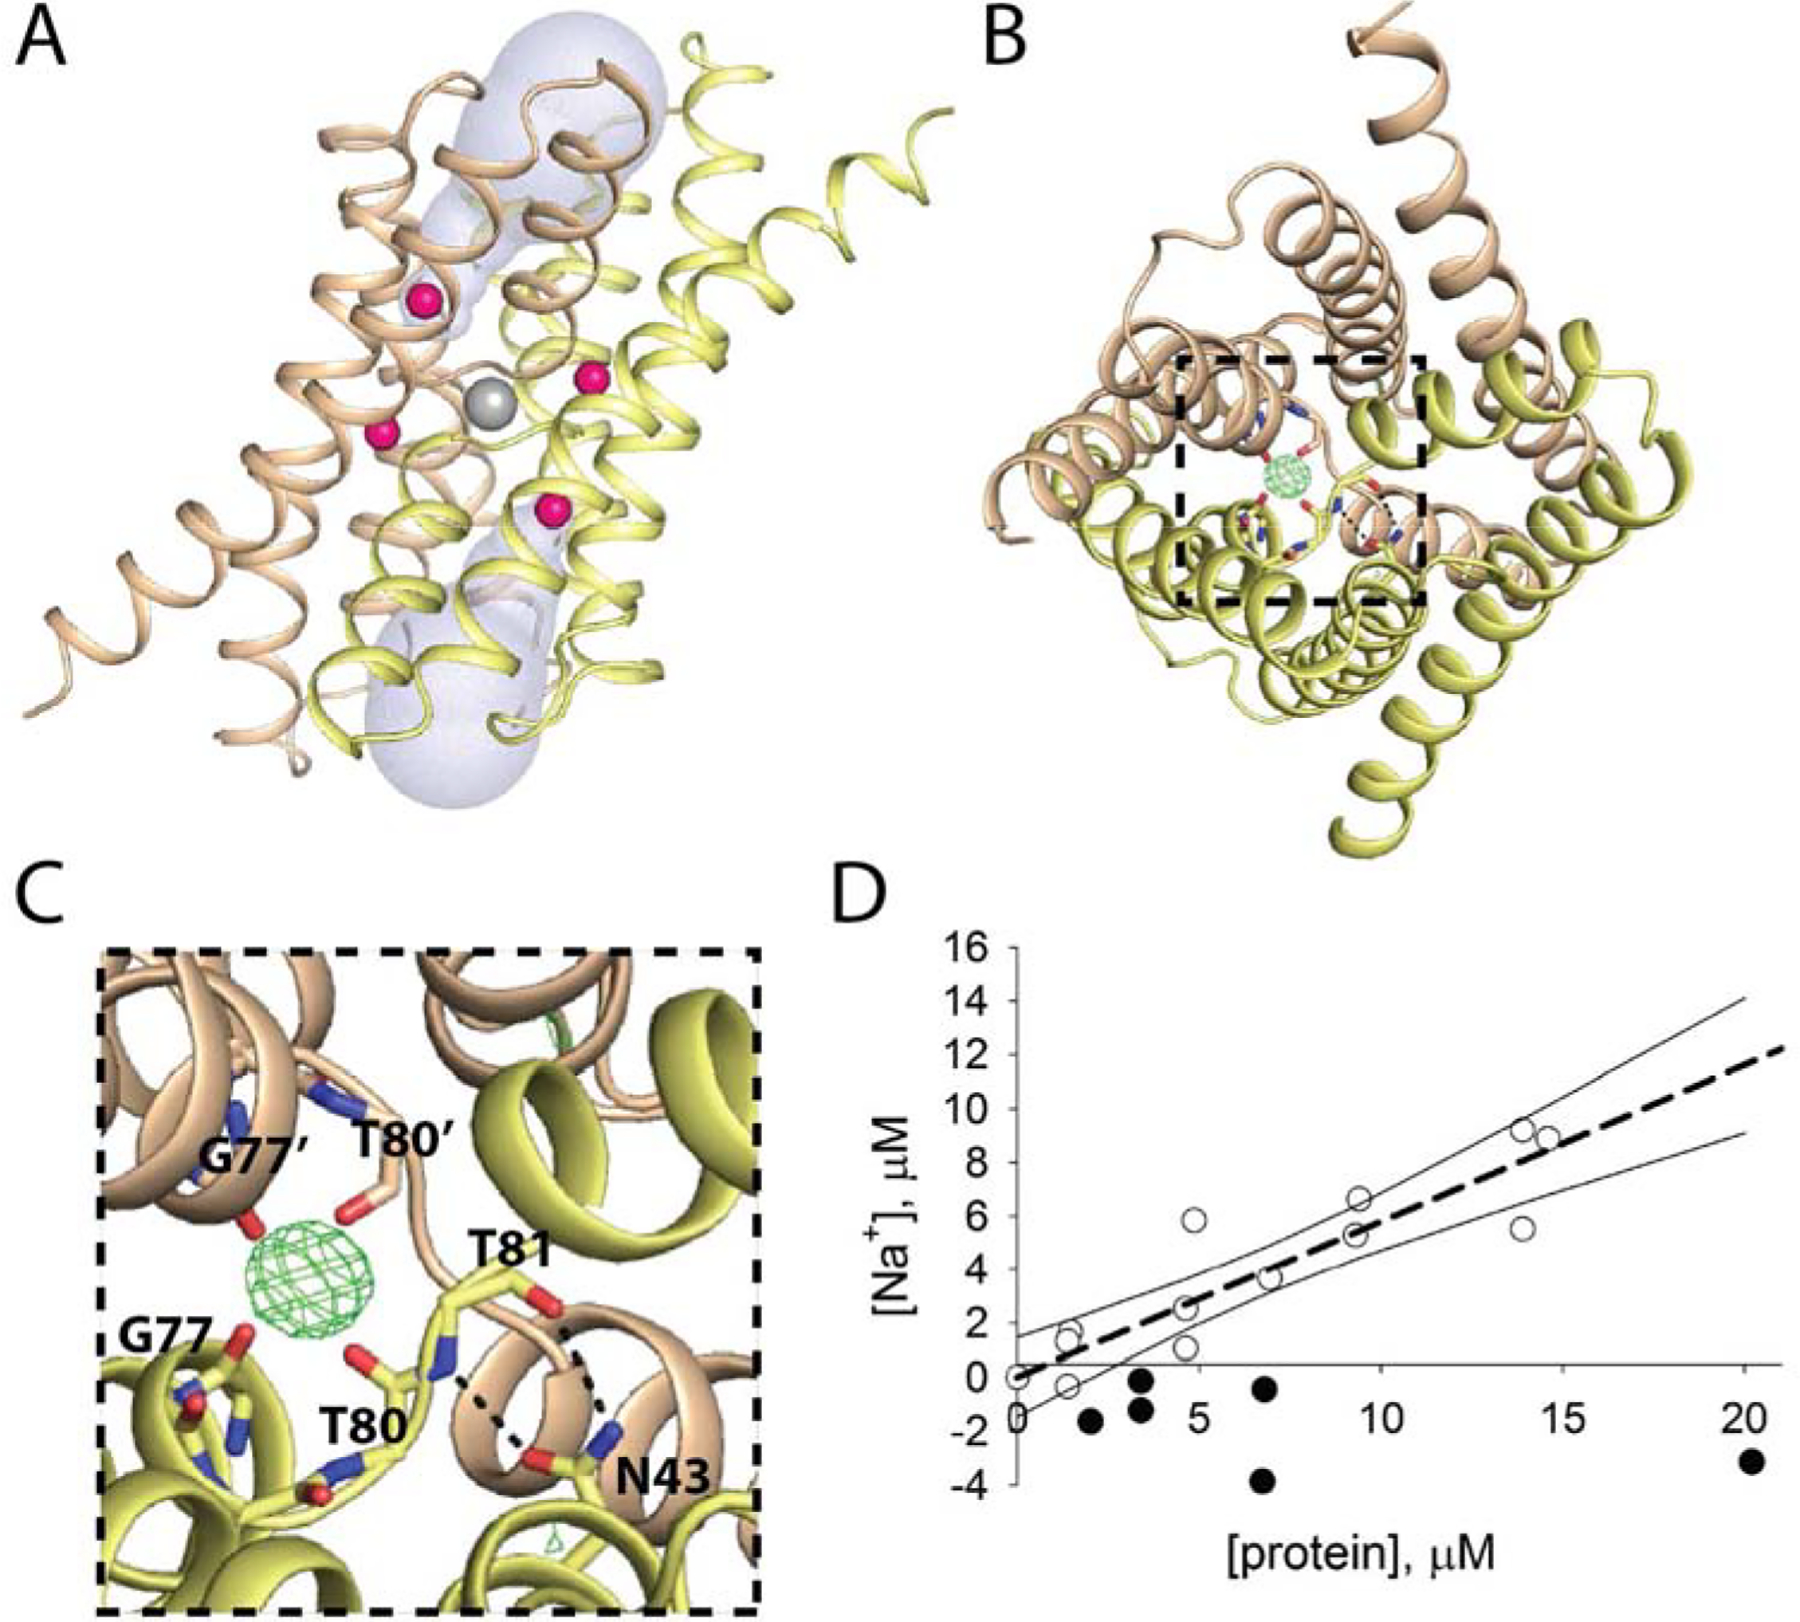
Figure 1.

Central cation in Fluc-Bpe (PDB: 5NKQ) A. Fluc viewed through the plane of the membrane. Subunits colored wheat and yellow, fluoride ions in pink, central cation in gray, and aqueous vestibules in blue surface representation. B. Top-down view of Fluc with mFo-DFc map contoured at 4σ around the central cation. N43 sidechain and main chain atoms from G77-T81 are shown as sticks. C. Zoomed in view of panel B. Residues within coordination distance of the central cation or within H-bonding distance of N43 are labeled. D. ICP-MS measurements of Na+ in samples of Fluc (open circles) and an unrelated fluoride transporter from the CLC family, CLCF-Eca (closed circles). Raw ICP measurements were converted into molarity by comparison to a standard curve, which was linear over this concentration range. Background Na+ from the final purification buffer (typically ~2–6 μM) was measured for each protein sample and subtracted from the total to yield the final Na+ concentration. The dashed line indicates a linear regression with a slope of 0.6, and the solid lines show the 95% confidence intervals for the fit.
