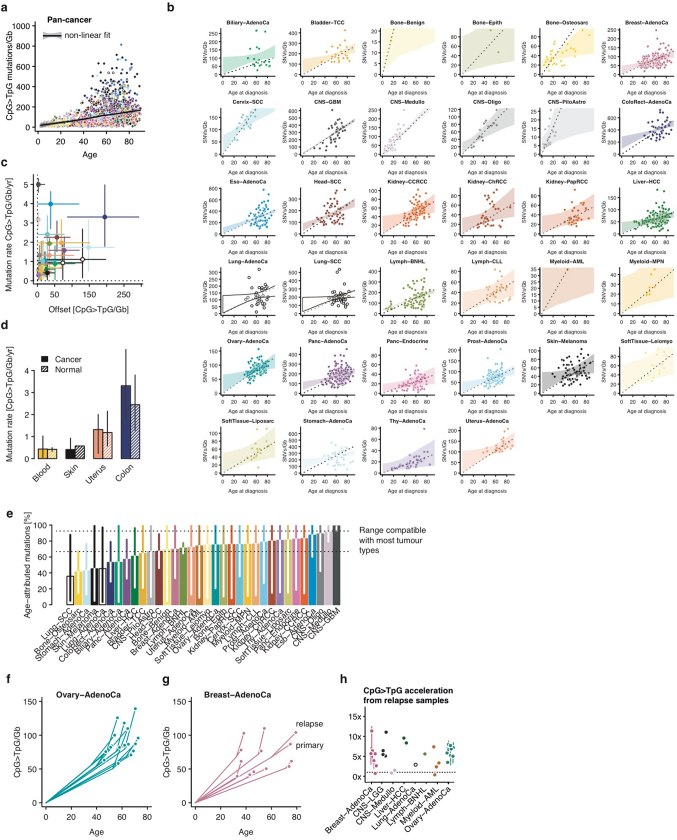
Extended Data Fig. 8. Age-dependent mutation burden and relapse samples indicate near-normal CpG>TpG mutation rate in cancer, with moderate acceleration during carcinogenesis.
a, Across all cancer samples, a predominantly linear accumulation of CpG>TpG mutations (scaled to copy number) is observed over time, as measured by the age at diagnosis. b, Cancer-specific analysis of the CpG>TpG mutation burden as a function of age at diagnosis for n = 1,978 samples of 34 informative cancer types. The dotted line denotes the median mutations per year (that is, not offset), and shading denotes the 95% credible interval of a hierarchical Bayesian linear regression model across all data points. Slope and intercepts are drawn for each cancer type from a gamma distribution, respectively; inference was done by Hamiltonian Monte Carlo sampling. c, Maximum a posteriori estimates of rate and offset for 34 cancer types with 95% credible intervals as defined in b. d, Mutation rate inferred from cancer as in b and from selected normal tissue sequencing studies of n = 140 normal haematopoietic stem cells, n = 1 normal skin sample, n = 182 samples from normal endometrium, and n = 445 normal colonic crypts; error bars denote the 95% confidence interval. e, Median fraction of mutations attributed to linear age-dependent accumulation, based on estimates from b and the age at diagnosis for each sample. Error bars denote the 95% credible interval. f, g, CpG>TpG mutations per gigabase for ovarian cancer (f) and breast cancer (g) samples with matched primary and relapse samples. h, Increase in CpG>TpG mutation rate inferred from paired primary and relapse samples for six cancer types. Bars denote the range of the rate increase for different scenarios of copy number evolution, assuming ploidy changes have occurred prior (upper value) or posterior (lower value) to the branching between primary and relapse sample.

