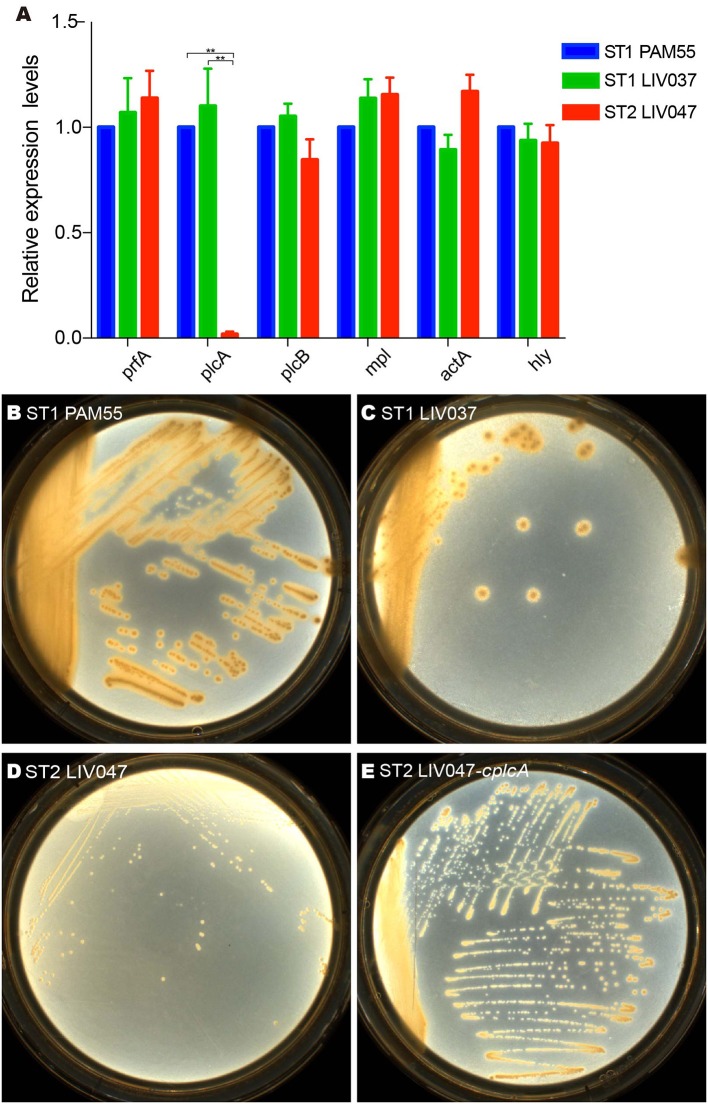
Figure 6.
(A) Relative quantification of LIPI-1 gene cluster transcriptional levels. The transcriptional level of each gene was normalized to that of 16SrDNA. Bars represent the mean of three replicates mean ± SD. **P < 0.01. (B–E) Colony morphology of L. ivanovii subsp. ivanovii strains on BHI plate containing 5% lecithin.

