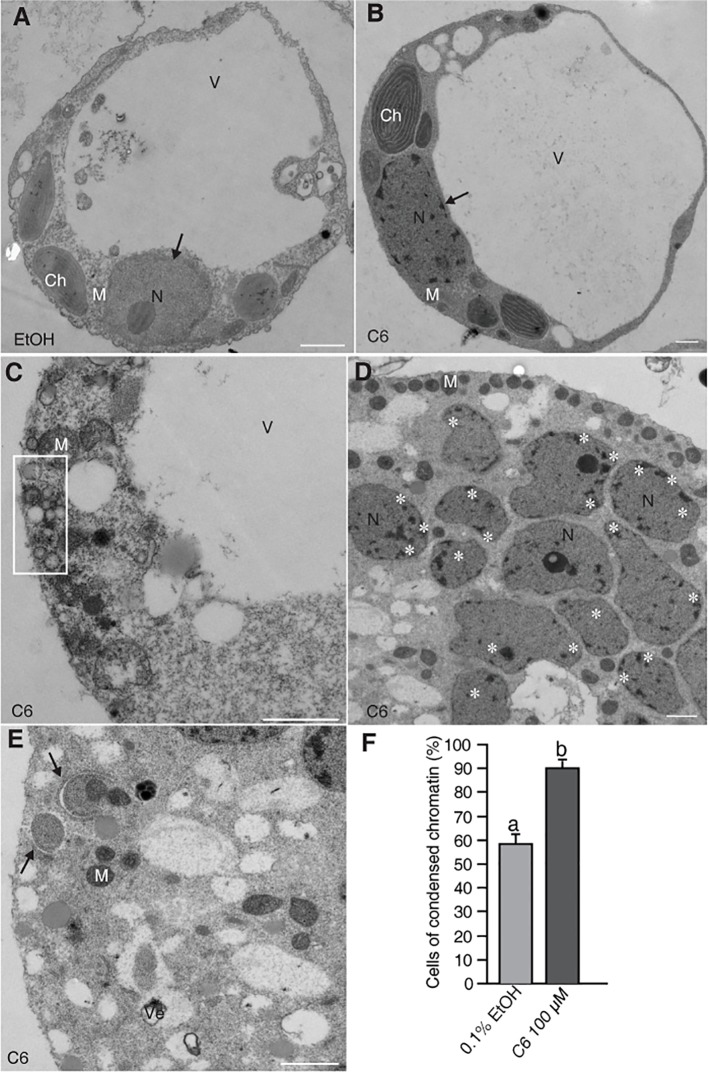
Figure 1.
Electron micrographs of rice protoplasts after C6 ceramide treatments. Rice protoplasts were incubated with solvent control (0.1% EtOH) or 100 µM C6 ceramide for indicated times and then fixed for electron microscopy observation. (A) A control cell. Note a normal vacuole and nucleus with nucleolus (arrow). (B) A C6 ceramide-treated cell. Note condensed chromatin in the nucleus (arrow) and relatively normal morphology of organelles. (C) A dying C6 ceramide-treated cell. Note abnormal mitochondria and vesicle clusters along plasma membrane (square). (D) A 36 h C6 ceramide-treated cell. Note numerous nuclear fragmented nuclei with condensed chromatin (white stars). (E) A 36 h C6 ceramide-treated cell. Note double-membrane bound autophagic vacuole (autophagosome) sequestering mitochondria (arrow). (F) The frequency of nuclei with condensed chromatin. A total of 20 cells were included for each treatment. This experiment was repeated three times using independent samples. Letters indicate that values differed based on Fisher’s protected least significant difference (PLSD) test, a post hoc multiple t test (p < 0.05). Error bars indicate standard deviations. Ch, chloroplast; M, mitochondrion; N, nucleus; V, vacuole; Ve, vesicle cluster. Bars in (A–E) = 1 µm.

