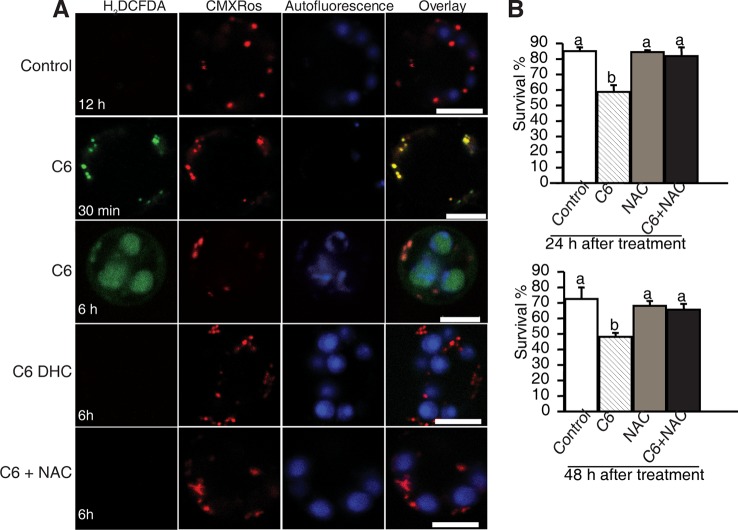
Figure 4.
ROS detection after ceramide treatments. (A) Confocal micrographs of ROS generation in ceramide-treated cells. Protoplasts from 10-day-old rice seedlings were treated with 100 μM C6 ceramide 100 μM C6 DHC, 5 μg/ml ROS scavenger NAC or 0.1% EtOH (solvent control) for 6 h and then stained with CM-H2DCFDA (green) and CMXRos (red). Images were taken by confocal microscopy. The red fluorescence indicates mitochondria (beam-splitter: MBS 458/561; emission filter: 568–691). Autofluorescence (blue) indicates chloroplasts (beam-splitter: MBS 488/561/633; emission filter: 647–722). This experiment was repeated three times using independent samples. Bar = 5 μm. (B) The survive rate of protoplasts treated with different reagents. Rice protoplasts were treated with 0.1% EtOH (solvent control), 100 μM C6 ceramide, 5μg/ml NAC, or NAC + 100 μM C6 ceramide for the indicated times under light. The experiment was repeated three times using independent samples. Letters indicate that values differed based on PLSD (p < 0.05). Error bars indicate standard deviations.

