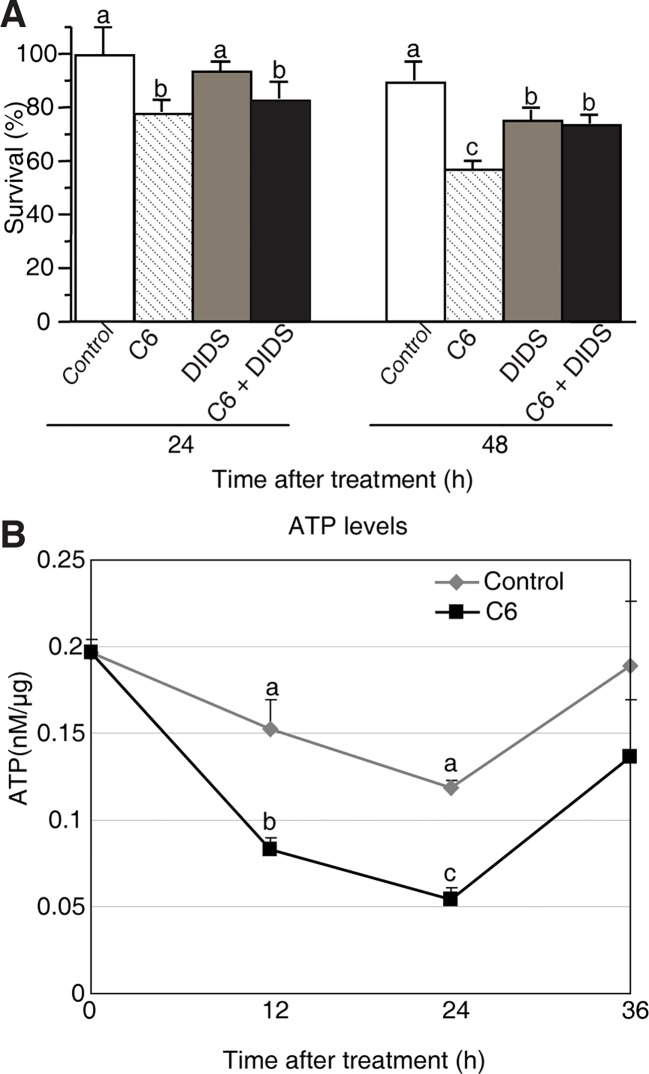
Figure 6.
Mitochondrial dysfunction induced by C6 ceramide treatments. (A) The survive rate of protoplasts treated with different reagents. Rice protoplasts were treated with control (0.1% ethanol plus 0.1% DMSO), 100 μM C6 ceramide, 1 μM DIDS, or 1 μM DIDS plus 100 μM C6 ceramide for the indicated times. The experiment was repeated three times using independent samples. Letters indicate that values differed based on PLSD (p < 0.05). Error bars indicate standard deviations. Control treatment was with 0.1% ethanol (the solvent for C6) plus 0.1% DMSO (the solvent for DIDS). (B) ATP levels were detected by using a luminometer at different time points. Protoplasts were treated with 100 μM C6 ceramide or 0.1% EtOH (as a control). ATP was measured as described in the Methods at the indicated times. The experimental points represent mean values from three replicate experiments. Letters indicate that values differed based on PLSD (p < 0.05). Error bars indicate standard deviations.

