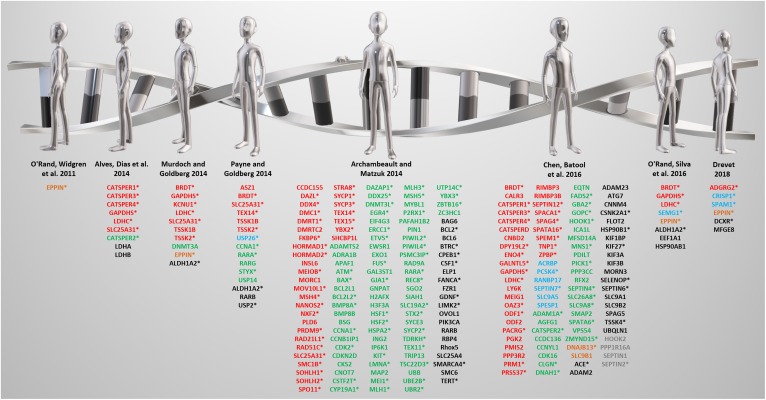
FIGURE 2.
A review of reviews from the past decade. Targets identified by the listed reviews are color-coded based on reproductive tract-specificity and fertility phenotype as follows: red = reproductive tract-specific displaying male infertility phenotype; green = non-reproductive tract-expressed and male infertility phenotype; blue = reproductive tract-specific displaying fertile or subfertile phenotype; orange = reproductive tract-specific with unknown fertility phenotype; black = non-reproductive tract-expressed displaying fertile or subfertile phenotype; gray = non-reproductive tract-expressed with unknown fertility phenotype. Expression and phenotype data obtained from Contraceptive Infertility Target DataBase (CITDBase), Human Protein Atlas (HPA), Ensembl Biomart, Mouse Genome Informatics (MGI), and the International Mouse Phenotyping Consortium (IMPC). *denotes genes implicated in human male infertility according to GeneCards and MalaCards.

