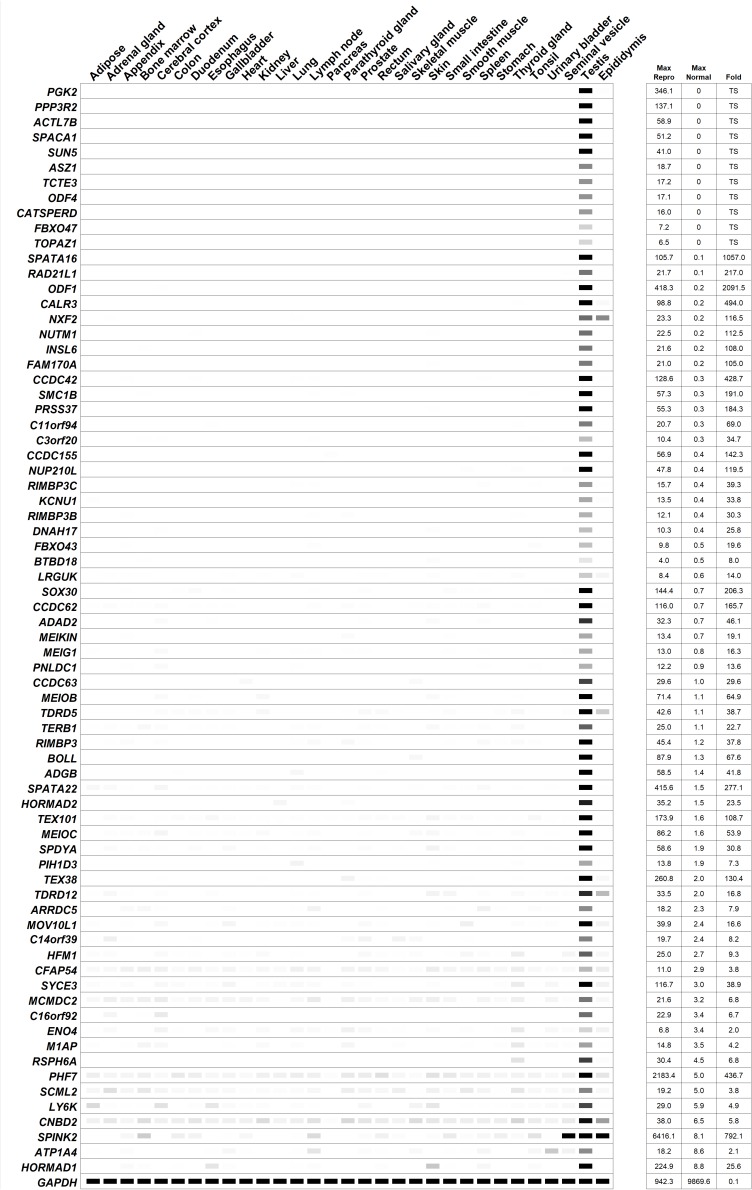
FIGURE 4.
Digital PCR (heatmap) depicting the average transcripts per million (TPM) value per tissue per gene from human RNAseq data published by the Human Protein Atlas (Djureinovic et al., 2014; Uhlen et al., 2015). White = 0 TPM, Black ≥ 30 TPM. The genes are ordered from most reproductive tract-specific to least based on the level of non-reproductive tissue expression. “Fold” = testis/max normal. The data was obtained from a tab-separated file including Ensembl gene identifier, analyzed sample, and TPM value per gene that was downloaded from the Human Protein Atlas website. The expression profile of the housekeeping genes, GAPDH, is included.

