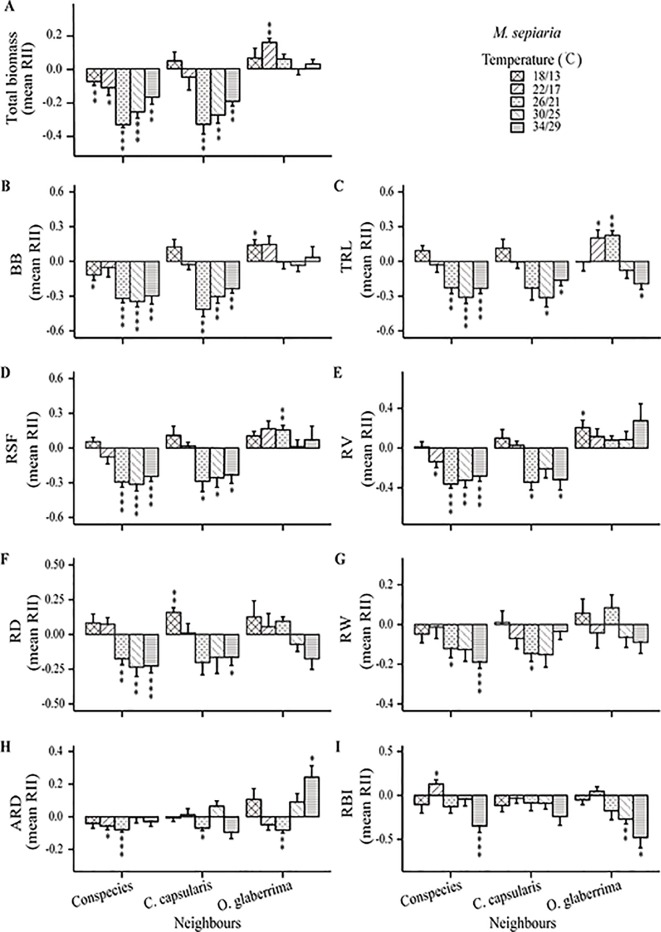
Figure 6.
Temperature effects on root relative interaction intensity (RII) with focal species M. sepiaria. Graphs show RII measured by (A) Total biomass, (B) BB, belowground biomass, (C) TRL, total root length, (D) RSF, root surface area, (E) RV, root volume, (F) RD, root depth, (G) RW, root width, (H) ARD, average root diameter and (I) RBI, root branching intensity. The bars are grouped by species-pair combination treatments and different bars represent different temperature treatments. Asterisks indicate one-sample t-tests for the difference from zero. *, P < 0.05; **, P < 0.01; ***, P < 0.001..

