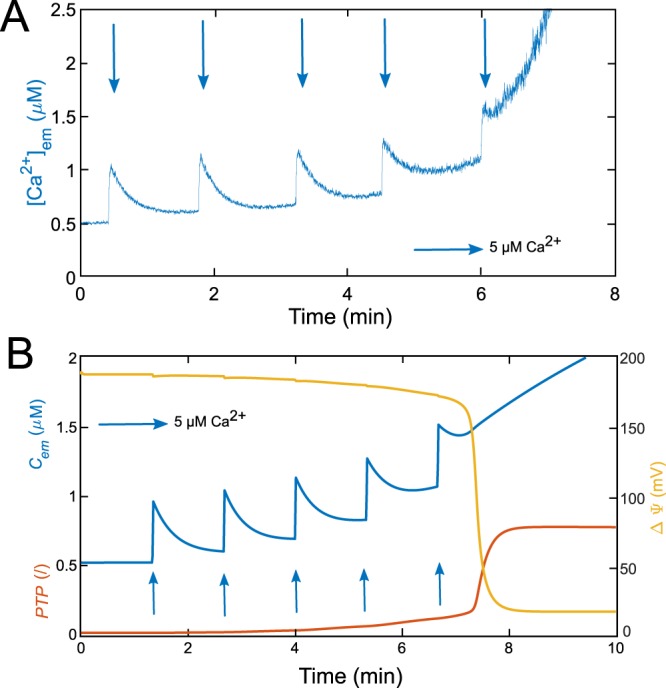
Figure 3.

Successive additions of Ca leading to mPTP opening in experiments and in the model. (A) Experiment performed in a suspension of mitochondria extracted from rat hepatocytes. The [Ca] is monitored by fluorescence using 5 Fluo-4. Following the addition of five Ca pulses (blue arrows), the mPTP opens, as attested by the sudden rise in Ca concentration in the medium. (B) Simulations of the five-variable model (Eqs. 1 and 4–7). The model successfully reproduces the [Ca] behaviour (in blue), in response to the Ca pulses (implemented with ). The final increase in the is associated with a sudden increase in mPTP opening (variable , standing for the fraction of open PTP, in red) and a fall in (in yellow). See Table S1 for parameter values.
