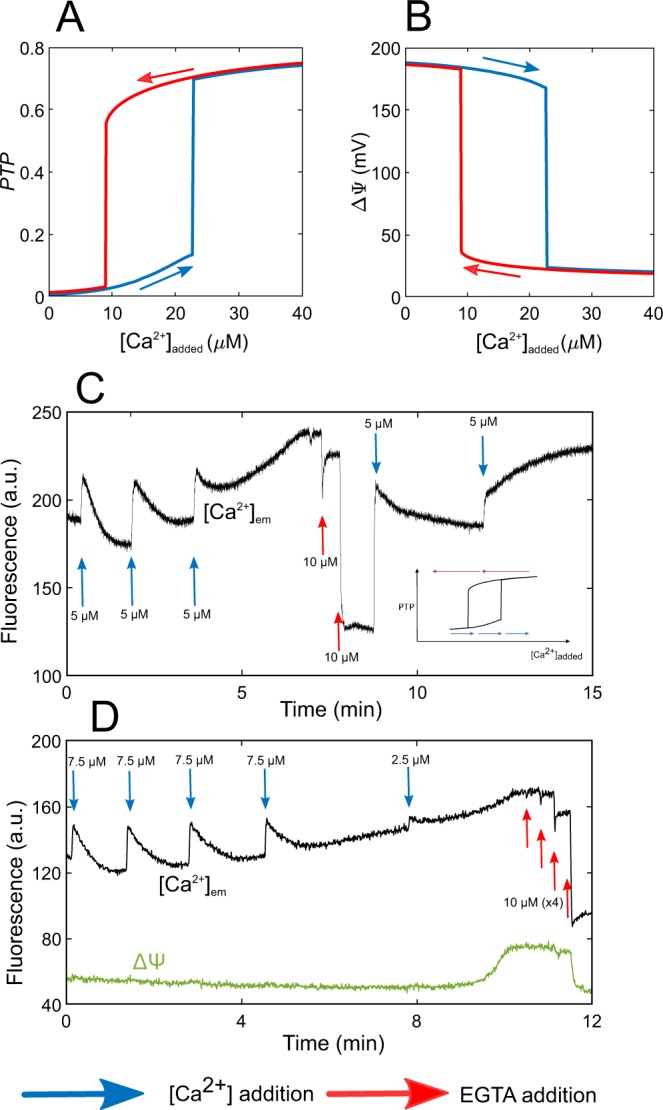
Figure 4.

mPTP opening corresponds to a bistable switch. Numerical bifurcation diagrams of the fraction of open mPTP, (A) and (B) as a function of added Ca. Blue and red curves stand for trajectories following Ca additions (from left to right) or Ca removal (from right to left), respectively. The equivalent bifurcation diagrams of and as a function of added Ca are shown in Fig. S1. (C,D) Experimental evidence for bistability of the mPTP in a hepatocyte mitochondrial suspension. Ca is monitored in the medium with 5 Fluo-4 (C,D) and with 5 TMRM (SI Appendix) (D). In both cases, the concentration of EGTA necessary to close the mPTP is larger than the concentration of Ca that allowed its opening. This highlights the existence of hysteresis as schematised in the inset in Panel (C). Panels (C,D) are representative of 12 similar experiments.
