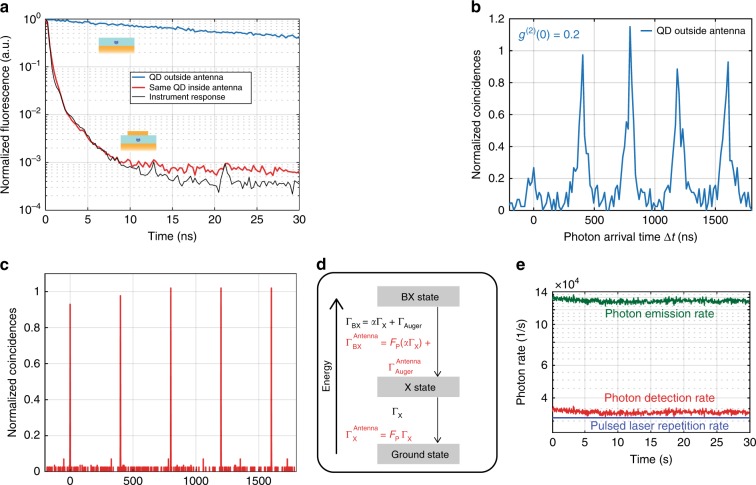
Fig. 4. Emission characteristics of a highly accelerated antenna.
a Fluorescence decay of the QD before (blue line) and after (red line) it is placed inside the antenna. The instrument response function is shown in black. b Normalized photon coincidences measured for the QD before insertion in the antenna and c inside the antenna under a pulsed excitation of 0.03 W/cm2 at 405 nm. d QD energy-level diagram showing the biexciton (BX), exciton (X), and ground states. e Detected photon rate (red) and the corresponding photon emission rate after the detection efficiency correction (green). The blue line denotes the pulsed laser repetition rate

