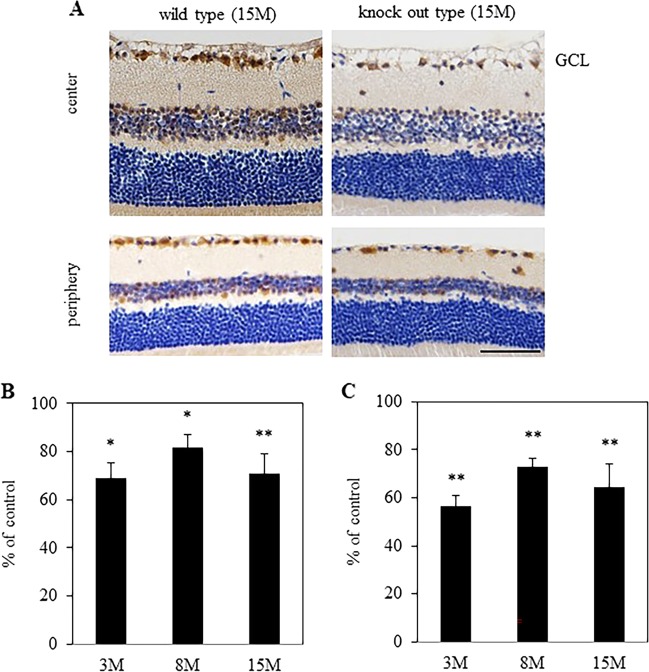
Fig. 4. Evaluating the number of RGCs with Brn-3a immunostaining.
a Typical micrographs of Brn-3a immunostaining in wild-type and knockout type at 15 months after birth. Micrographs of the central and peripheral areas were taken 0.3–0.5 mm and 1.4–1.6 mm from optic nerve head. The number of RGCs were counted with Brn-3a immunostaining in the central (b) and peripheral (c) areas. Result were expressed as the mean ± SEM. 3 M: n = 5, 8 M: n = 9, 15 M: n = 7. *P < 0.05, **P < 0.01 versus control (Student t-test). Scale bar, 50 μm.

