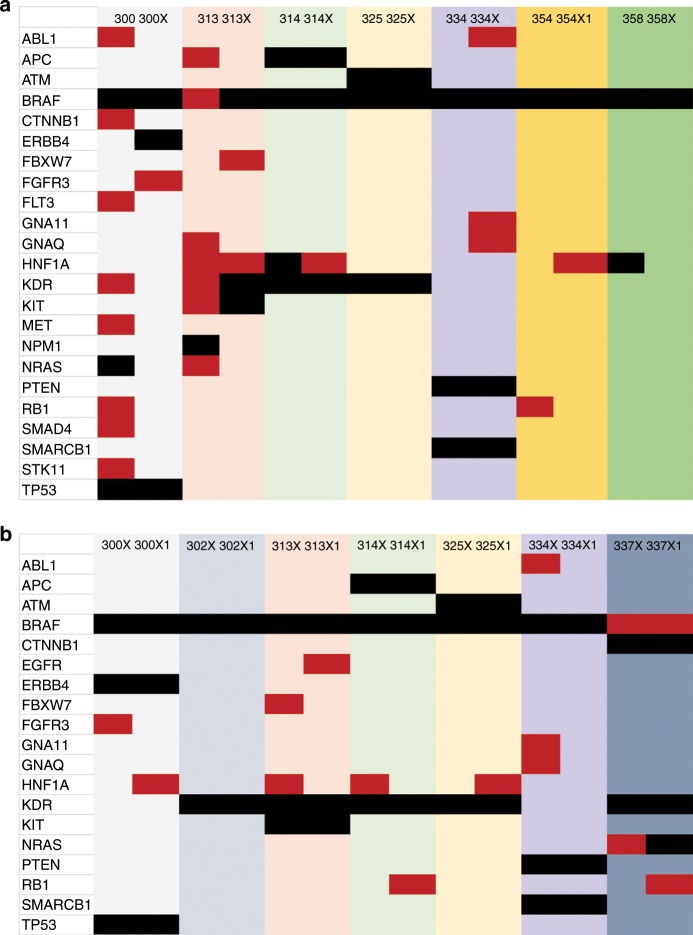
Fig. 1. Comparison of SNV and insertion/deletion (ins/del) variants of DNA mutational hotspots from patient tumour and first- and second-generation PDX derivatives.
a Patient tumour and corresponding first-generation (X) PDX, and b X and second-generation (X1) PDX generations were compared. The matched pairs are grouped using coloured columns, for example, MM300 with MM300X (light grey). The mutations identified are listed by row (far left column). Red indicates an allele frequency (AF) 5–24%. Black indicates an AF ≥ 25%.

