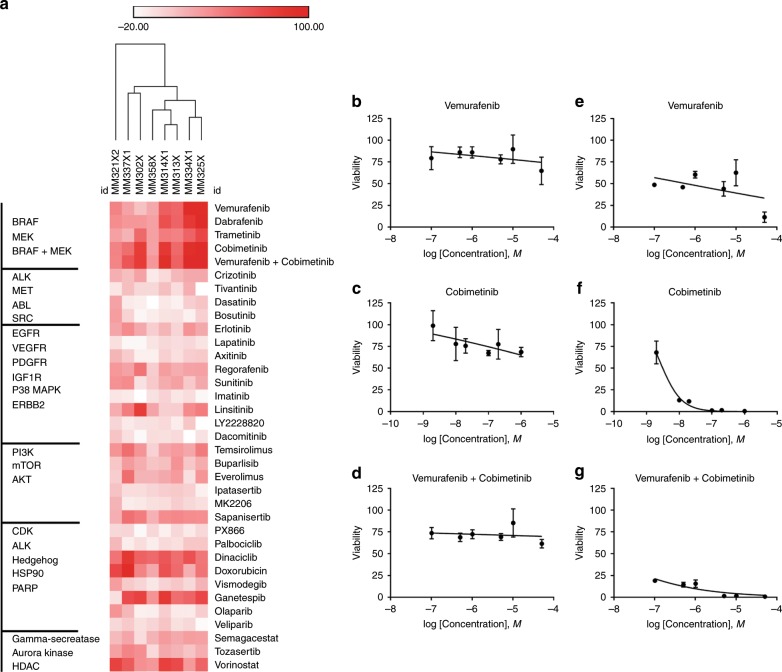
Fig. 2. HTDS in eight BRAF-mutant melanoma PDXCs.
a Hierarchical clustering of effects of single agent and vemurafenib + cobimetinib combination on melanoma cell viability/proliferation of eight PDXCs. Drug score of 0 equals no effect and 100 represents killing all the cells. Drugs that stimulate cell growth produce a score < 0. Darkest red of the heatmap indicates greatest inhibition of cell viability/proliferation and white equals no response. Drugs (right) were arranged based on the primary drug target (left). b–d Response of MM358X from a patient that progressed on BRAF and MEK inhibitors. e, f Response of MM314X from a patient not previously treated with BRAF and MEK inhibitors. Error bars are SD of n = 3 replicates.

