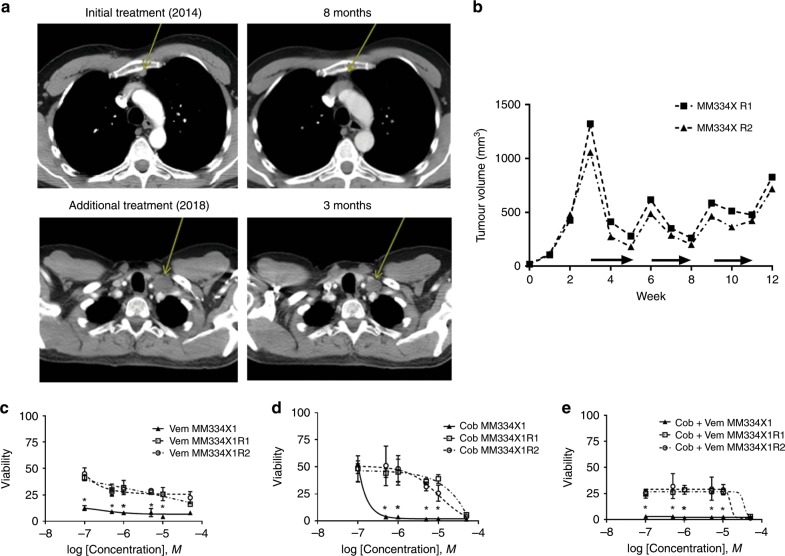
Fig. 5. Biological consistency of producing targeted therapy responses in PDXs.
a Upper left, CT scan of patient MM334 presenting with a metastatic melanoma to the right inguinal lymph node (yellow arrow). Upper right, remission of tumour after treatment with BRAF and MEK inhibitors (yellow arrow). Lower left, recurrence of the melanoma in the left subclavicular lymph node. Lower right, tumour persisting after BRAF and MEK inhibitor treatment. b Resistance training of two MM334 PDX tumours. Horizontal arrows indicate periods of treatment with BRAF and MEK inhibitors. HTDS response to (c) vemurafenib, (d) cobimetinib and (e) cobimetinib + vemurafenib in pre- (solid line) and post-resistance (dashed lines) MM334 PDXC. (*) indicates statistically significant differences between resistant and control groups (p < 0.05).

