Figure 1.
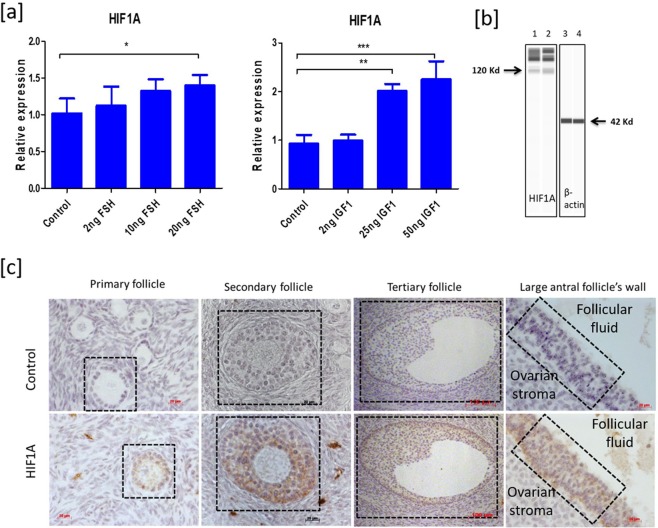
Expression analysis of HIF1A in granulosa cells. (a) indicates the mRNA expression of HIF1A under different FSH and IGF1 concentrations. (b) Indicates the detection of HIF1A protein under normoxia. The lane numbers 1–4 indicate the western runs of individual protein lysates. Columns 1 and 2 represent duplicates of HIF1A probing in FSH (20 ng/ml) and IGF1(50 ng/ml) treated GC under normoxia while columns 3 and 4 represent the Beta actin (BACT) probing in the corresponding samples. The arrow marks in (b) indicate the HIF1A (columns 1 and 2) and BACT (columns 3 and 4) protein bands. The image is obtained with the exposure time of 8 seconds in Simple Western instrument. (c) illustrates the immunolocalization of HIF1A in different growing ovarian follicles of abattoir ovaries. The brown color immunochemical signal indicates the HIF1A staining inside the follicle. 400x optical magnification was used for primary and secondary and large antral follicle’s wall. 100x optical magnification was used for tertiary follicles in the pictures. Inside dotted box indicates the specific follicle for primary, secondary and tertiary follicle sections whereas dotted box points the GC layer in large antral follicle’s wall. Data were presented in Mean ± SEM values of three independent cell culture experiments (n = 3) for Fig. 1a. Significant differences were acknowledged at the minimum level of p < 0.05 by one way repeated measures analysis of variance. Pairwise comparisons were analyzed using Post hoc Tuckey test.

