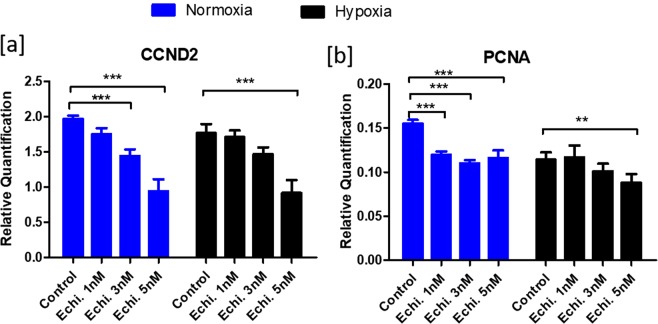
Figure 4.
Effects of echinomycin on cell proliferation markers: Figure depicts the normalized mRNA expression data of CCND2 (a) and PCNA (b) genes upon inhibition of HIF1 activity using echinomycin. Data were presented in Mean ± SEM values of three independent cell culture experiments (n = 3). Significant differences were acknowledged at the minimum level of p < 0.05 by one way repeated measures analysis of variance. Pairwise comparisons were analyzed using Post hoc Tuckey test.

