
Figure 2.
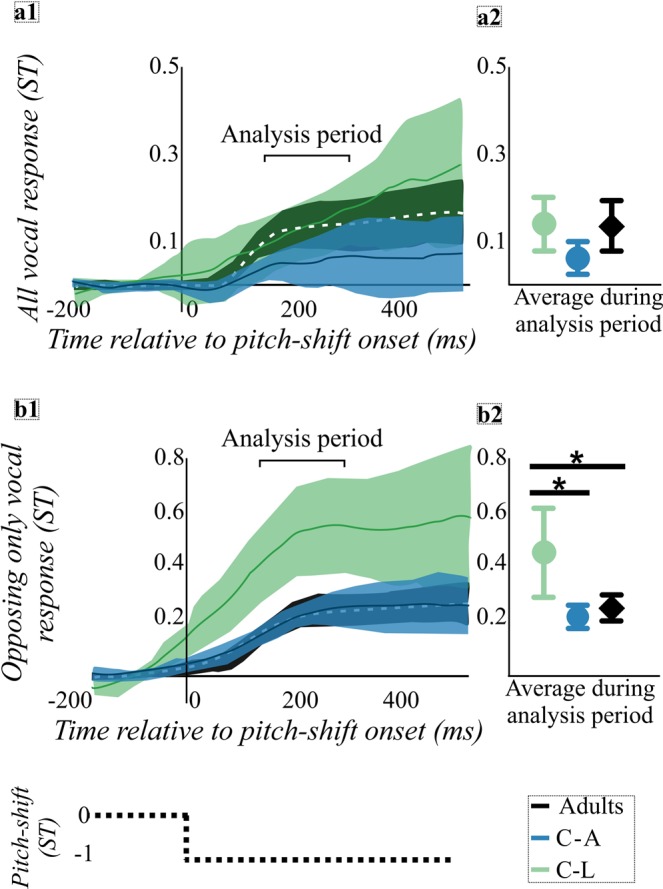
Data from children with adult-like pitch discrimination abilities (C-A, blue), children with less sensitive pitch discrimination abilities (C-L, green), and adults (black) are shown for all vocal responses to unexpected pitch-shifts (panels a1-a2), and opposing only vocal responses to unexpected pitch-shifts (panels b1-b2). The dotted black line shows a schematic of a single -1 ST unexpected pitch-shift as a function of time relative to pitch-shift onset. Means (solid lines: C-A and C-L, white dashed line: adults) and confidence intervals (CI, shaded areas) shown as a function of time relative to pitch-shift onset for all vocal responses to unexpected pitch-shifts (panel a1) or opposing only vocal responses to unexpected pitch-shifts (panel b1). Analysis period, highlighted by bracket, is 150–300 ms after pitch-shift onset. Group means and 95% CIs during the analysis period for all vocal responses to unexpected pitch-shifts (panel a2) or opposing only vocal responses to unexpected pitch-shifts (panel b2). The C-L group had significantly larger vocal response magnitudes than the C-A and adult groups for opposing only vocal responses (panel b2), indicated by asterisks.