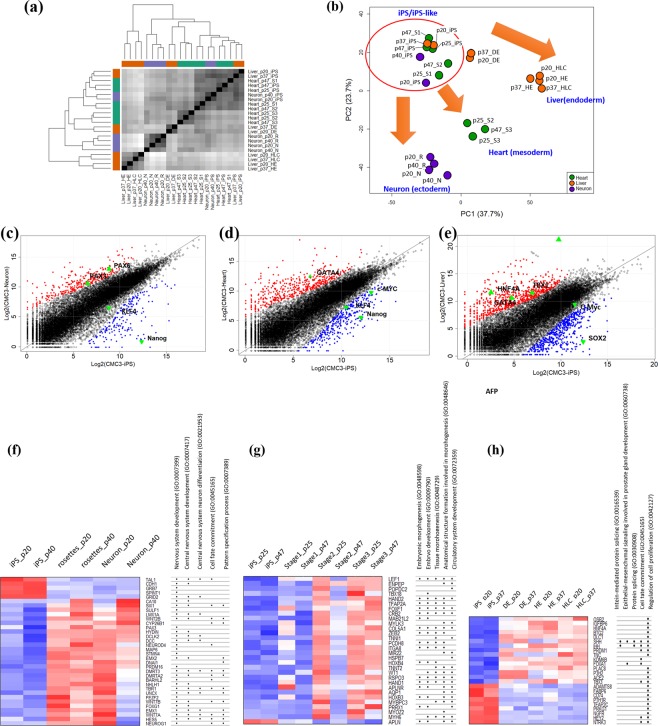
Figure 3.
Characterization of differentiated cells of three lineages and the original human induced pluripotent stem cells (hiPSCs) at the transcriptome level. Global transcriptome analysis of hiPSC lines and differentiated cells. (a) Relationship of transcriptome profiles among the cells. Sample-to-sample distance matrix with hierarchical clustering. (b) Principal component analysis (PCA) of all lines. Neuronal cells (purple circles), cardiomyocytes (green circles), and hepatocyte-like cells (orange circles) were differentiated from hiPSCs. hiPSCs and iPS-like cells that divided with hiPSCs are highlighted with red circles. (c–e) Scatter plot of log2-normalized read counts for differentiated lines, neuronal cells, cardiomyocytes, and hepatocytes in the final stages compared with the original hiPSC lines. Lineage-specific markers for each lineage (filled triangles) and hiPSC-specific markers (inverted filled triangles) are indicated. Up- and downregulated genes are also denoted by red and blue circles, respectively. PAX3, paired box 3; PAX6, paired box 6; KLF, Krüppel-like factor 4; GATA binding protein 4, GATA4; AFP, alpha foetoprotein; TBX1, T-box 1. The top five gene ontology (GO) categories for the common differentially expressed genes (DEGs) identified during the differentiation process for each lineage (i.e., neuronal cells (f), cardiomyocytes (g), and hepatocyte-like cells (h)) are shown. The heatmap for GO analysis indicates the expression of each gene at each stage during differentiation.

