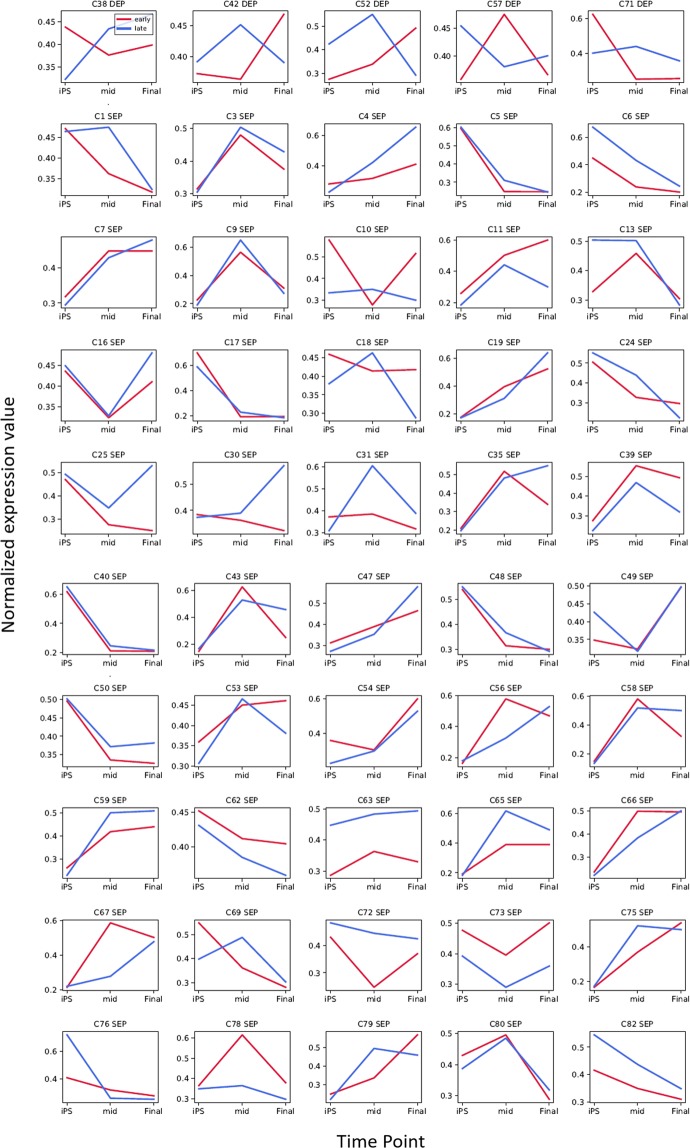
Figure 4.
Time-course transcriptome analysis of differentiation during early and late passages. Comparison of expression profiles between early (red bars) and late (blue bars) passages at three time points [human induced pluripotent stem cells (hiPSCs), the middle stage of differentiation, and the final stage of differentiation]. Forty similar expression patterns (SEPs) and five differential expression profiles (DEPs) are shown in the top and bottom panels, respectively. The normalized expression values were applied to calculate relative expression. The number at the top of each graph indicates the number of clusters. ODEP: obscure DEP.

