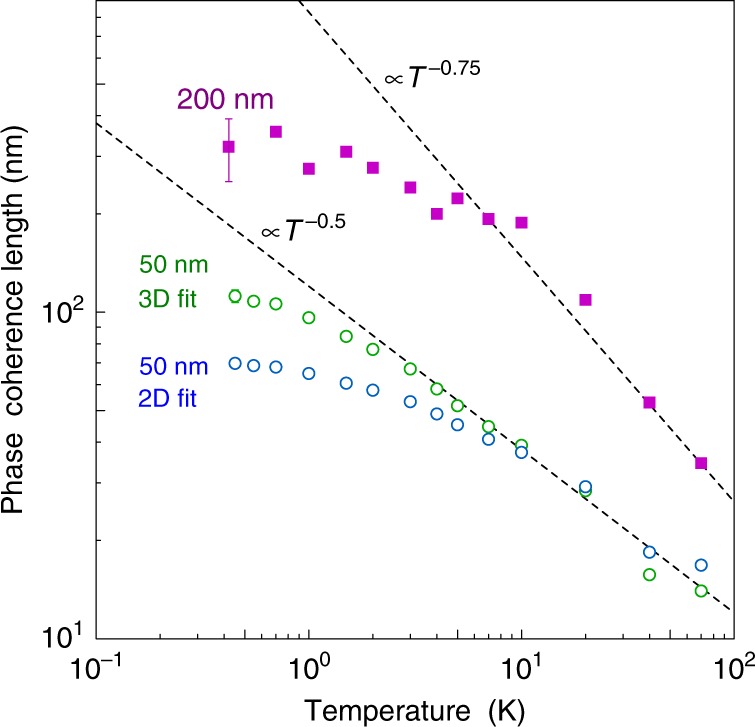
Fig. 6. Temperature dependence of phase coherence length in Sr3SnO obtained from localization analysis.

Filled symbols represent data for a 200-nm-thick film analyzed by the 3D localization formula, whereas open symbols represent those for a 50-nm-thick film analyzed by the 3D formula and 2D formula (HLN formula). Error bars are estimated at the lowest temperature for each data using standard deviation. For the 50-nm film, the error was comparable or smaller than the size of the open symbols. Theory predicts dephasing from electron–electron interaction to follow lϕ = T−0.75 in 3D systems (upper dashed line), while lϕ = T−0.5 in 2D systems (lower dashed line). Source Data are provided as a Source Data file.
