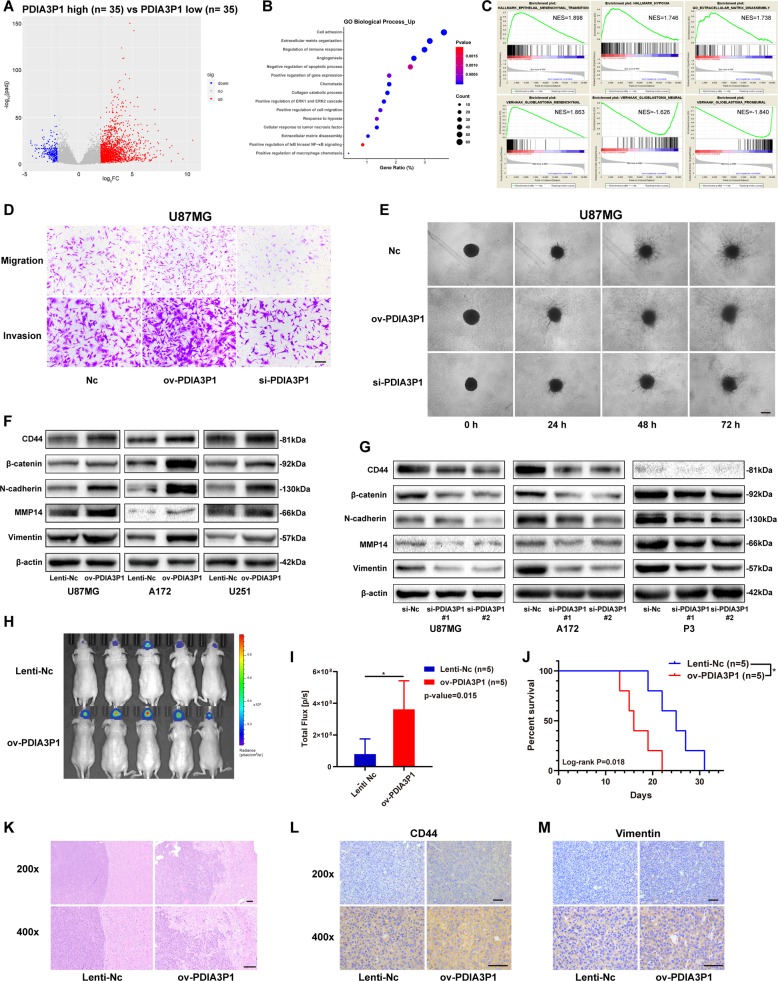
Fig. 2. PDIA3P1 promoted migration and invasion of glioma cells in vitro and in vivo.
a Volcano plot showing the differentially expressed genes between high-PDIA3P1 expressing patients (n = 35) and low-PDIA3P1 expressing patients (n = 35) according to the TCGA-GBM database. b Biological process enrichment analysis of upregulated genes in a. Positively correlated processes are listed on the y-axis. c GSEA confirming that high PDIA3P1 was associated with hypoxia and epithelial-mesenchymal transition (EMT), while low PDIA3P1 was associated with neural and proneural subtypes. d Migration and invasion capacity of U87MG cells transfected with control lentivirus (Lenti-Nc) or PDIA3P1 overexpressing lentivirus (ov-PDIA3P1), and siRNAs were assessed using transwell assay. Representative photographs are shown, scale bar: 100 μm. e 3D tumor spheroid invasion assay of U87MG cells transfected with lentivirus and siRNA. Representative images at 0 h, 24 h, 48 h, and 72 h are shown, scale bar: 200 μm. f Protein level of MES markers in U87MG, A172, and U251 cells transfected with the lentivirus overexpressing a control sequence or PDIA3P1 were assessed by western blotting. β-actin was used as control for normalization. g Protein level of MES markers in U87MG, A172 and P3 cells transfected with si-Nc and si-PDIA3P1 were assessed by western blotting. β-actin was used as control for normalization. h In vivo bioluminescent imaging analysis of tumor growth in xenograft nude mice at day 10. i Quantification of luminescent signals in the Lenti-Nc and ov-PDIA3P1 mice. j Survival analysis of nude mice orthotopically implanted with U87MG cells transfected with lentivirus overexpressing the control sequence or PDIA3P1. (P = 0.018 by log-rank analysis; data from 5 animals/group). k H&E staining of xenograft sections from PDIA3P1 overexpressing or negative control U87MG cell tissues on the same day of execution, scale bar: 100 μm. l, m Protein levels of CD44 (l) and Vimentin (m) in xenograft sections from PDIA3P1 overexpressing or negative control U87MG cell tissues were determined by immunohistochemistry (IHC) staining, scale bar: 50 μm. Data are shown as the mean ± standard error of three independent experiments. Statistical significance was determined using Student’s t test and log-rank analysis. (*P < 0.05; **P < 0.01 and ***P < 0.001).

